
end of header
Newsroom Archive
Release Information
Contact: Public Information Office
301-763-3030
FOR IMMEDIATE RELEASE: WEDNESDAY, APRIL 25, 2012
2010 Census Shows Interracial and Interethnic Married Couples Grew by 28 Percent over Decade
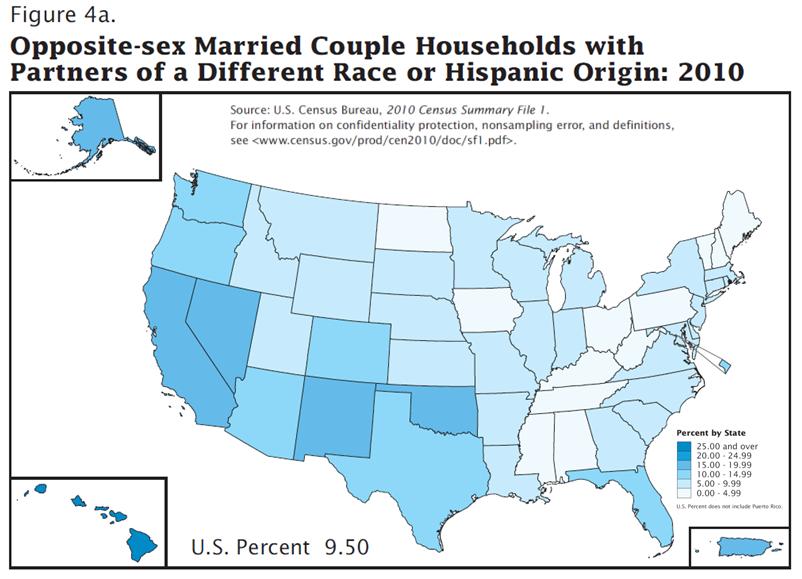
The U.S. Census Bureau today released a 2010 Census brief, Households and Families: 2010, that showed interracial or interethnic opposite-sex married couple households grew by 28 percent over the decade from 7 percent in 2000 to 10 percent in 2010. States with higher percentages of couples of a different race or Hispanic origin in 2010 were primarily located in the western and southwestern parts of the United States, along with Hawaii and Alaska.
A higher percentage of unmarried partners were interracial or interethnic than married couples. Nationally, 10 percent of opposite-sex married couples had partners of a different race or Hispanic origin, compared with 18 percent of opposite-sex unmarried partners and 21 percent of same-sex unmarried partners.
Growth in Nonfamily Households Double that for Family Households
The brief revealed that the percent increase for nonfamily households between 2000 and 2010 was double that for family households. The number of nonfamily households increased 16 percent, from 34 million in 2000 to 39 million in 2010, while family households increased 8 percent, from 72 million in 2000 to 78 million in 2010. Sixty-six percent of all households in 2010 were family households — defined as a household where two or more people who are related by birth, marriage or adoption live together. Forty-eight percent of all households in 2010 were husband-wife households.
A common nonfamily household type is those living alone. The percentage of households containing just one person increased from 25.8 percent in 2000 to 26.7 percent in 2010. Atlanta and Washington had the highest percentage of one-person households, among places with 100,000 people or more. In both cities, 44 percent of households contained just one person.
Despite the diversity among households in the United States in 2010, the majority of the population fell into three groups in terms of their relationship to the person who owned or rented the home (the householder). The householder, their spouse, and their sons and daughters comprised 262 million people or 87 percent of the population in 2010. Of the 89 million children of householders, 93 percent were biological children. There were approximately twice as many stepchildren (4.2 million) as adopted children (2.1 million).
Other Findings
- There was a 41 percent increase in unmarried partner households between 2000 and 2010. Opposite-sex unmarried partner households grew from 4.9 million in 2000 to 6.8 million in 2010. Same-sex unmarried partner households grew from 358,000 to 646,000 from 2000 to 2010, or from 0.3 percent of all households to 0.6 percent of all households.
- Multigenerational households — households containing three or more parent-child generations — increased from 3.9 million in 2000 to 5.1 million in 2010. Nine percent of households in Hawaii were multigenerational households, which is the highest for the nation.
- There were fewer households with people under the age of 18 living in them than in 2000. These households dropped from 36 percent in 2000 to 33 percent in 2010.
- The percent of households with people 65 and older increased across the decade. In 2000, 23 percent of households included someone 65 and over, compared with 25 percent in 2010.
 Yes
Yes
 No
No
Comments or suggestions?