
end of header
Newsroom Archive
Release Information
Contact: Melanie Deal
Public Information Office
301-763-3030
FOR IMMEDIATE RELEASE: MONDAY, DEC. 10, 2012
Census Bureau Reports National Mover Rate Increases After a Record Low in 2011
The U.S. Census Bureau announced today that the nation’s overall mover rate increased from a record low of 11.6 percent in 2011 to 12.0 percent in 2012. About 36.5 million people 1 year and older moved, an increase from the 2011 estimate of 35.1 million. In 2012, the majority of people who lived at a different residence 1 year ago moved within the same county (64.4 percent).
Among the 11.8 million intercounty movers — people who moved to another county, either within the same state or to a different state — the most common distance moved was less than 50 miles, with 40.2 percent. Therefore, even though they moved to a different county, the largest percentage did not move far from their previous place of residence.
This information comes from Geographical Mobility: 2012, a collection of national- and regional-level tables from the Annual Social and Economic Supplement of the Current Population Survey. The tables describe the movement of people in the United States, including type of move, why they moved, distance moved and characteristics of those who moved one year earlier.
These tables are part of four migration-related data products released today:
- 2011-2012 Geographical Mobility detailed tables
- 2005-2010 Geographical Mobility report and detailed tables
- 2012 historical migration visualizations, a set of historical graphs and charts available for the first time with data extending back to 1948
- 2011 American Community Survey state-to-state flow tables.
“The overall mover rate for the nation has increased since a record low. However, compared to previous years, mobility is still low for even our most mobile age group (18 to 29 year olds),” said Alison Fields, chief of the Census Bureau's Journey-to-Work and Migration Statistics Branch. “The statistics on migration come from two different surveys that, taken together, allow a clear and detailed picture of the movement of people in the U.S.”
The Most Common State-to-State Moves
Today the Census Bureau also released state-to-state migration flow tables with 2011 American Community Survey estimates. The American Community Survey provides demographic, social, economic and housing statistics, including geographical mobility for every community across the nation every year.
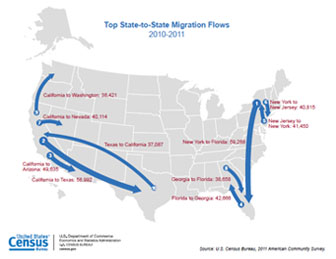
The most common state-to-state moves in 2011 were:
- New York to Florida: 59,288 movers
- California to Texas: 58,992
- California to Arizona: 49,635
- Florida to Georgia: 42,666
- New Jersey to New York: 41,450
- New York to New Jersey: 40,815
- California to Nevada: 40,114
- Georgia to Florida: 38,658
- California to Washington: 38,421
- Texas to California: 37,087
It should be noted that the top 10 migration flows may not be significantly different from each other or flows outside the top 10.
In 2011, 76,218 people residing in the U.S. lived in Puerto Rico one year earlier, while 22,649 people in Puerto Rico lived in the U.S. one year earlier. The state with the largest flow of people moving from Puerto Rico was Florida with 21,611 movers. Florida also had the most movers to Puerto Rico with 6,614.
Metro and Suburban Moving Patterns
According to the 2005-2010 Current Population Survey Geographical Mobility tables, areas within metropolitan areas, defined as either principal cities or suburbs, had different domestic migration patterns. Between 2005 and 2010, 15.4 million people moved out of principal cities while 11.0 million moved in — a decrease of 4.4 million movers. Suburbs had 17.9 million move in and 9.2 million move out — an increase of 8.8 million movers.
Additional Releases about Migration
In early 2013, the Census Bureau will release additional American Community Survey statistics about migration. These statistics will include tables for each county in the nation, showing the number of moves between pairs of counties by age, sex, race and Hispanic origin.
 Yes
Yes
 No
No
Comments or suggestions?