Visualizing the U.S. Economy: Explore Sectors by Geography
Select Statistics From the 2023 Annual Integrated Economic Survey
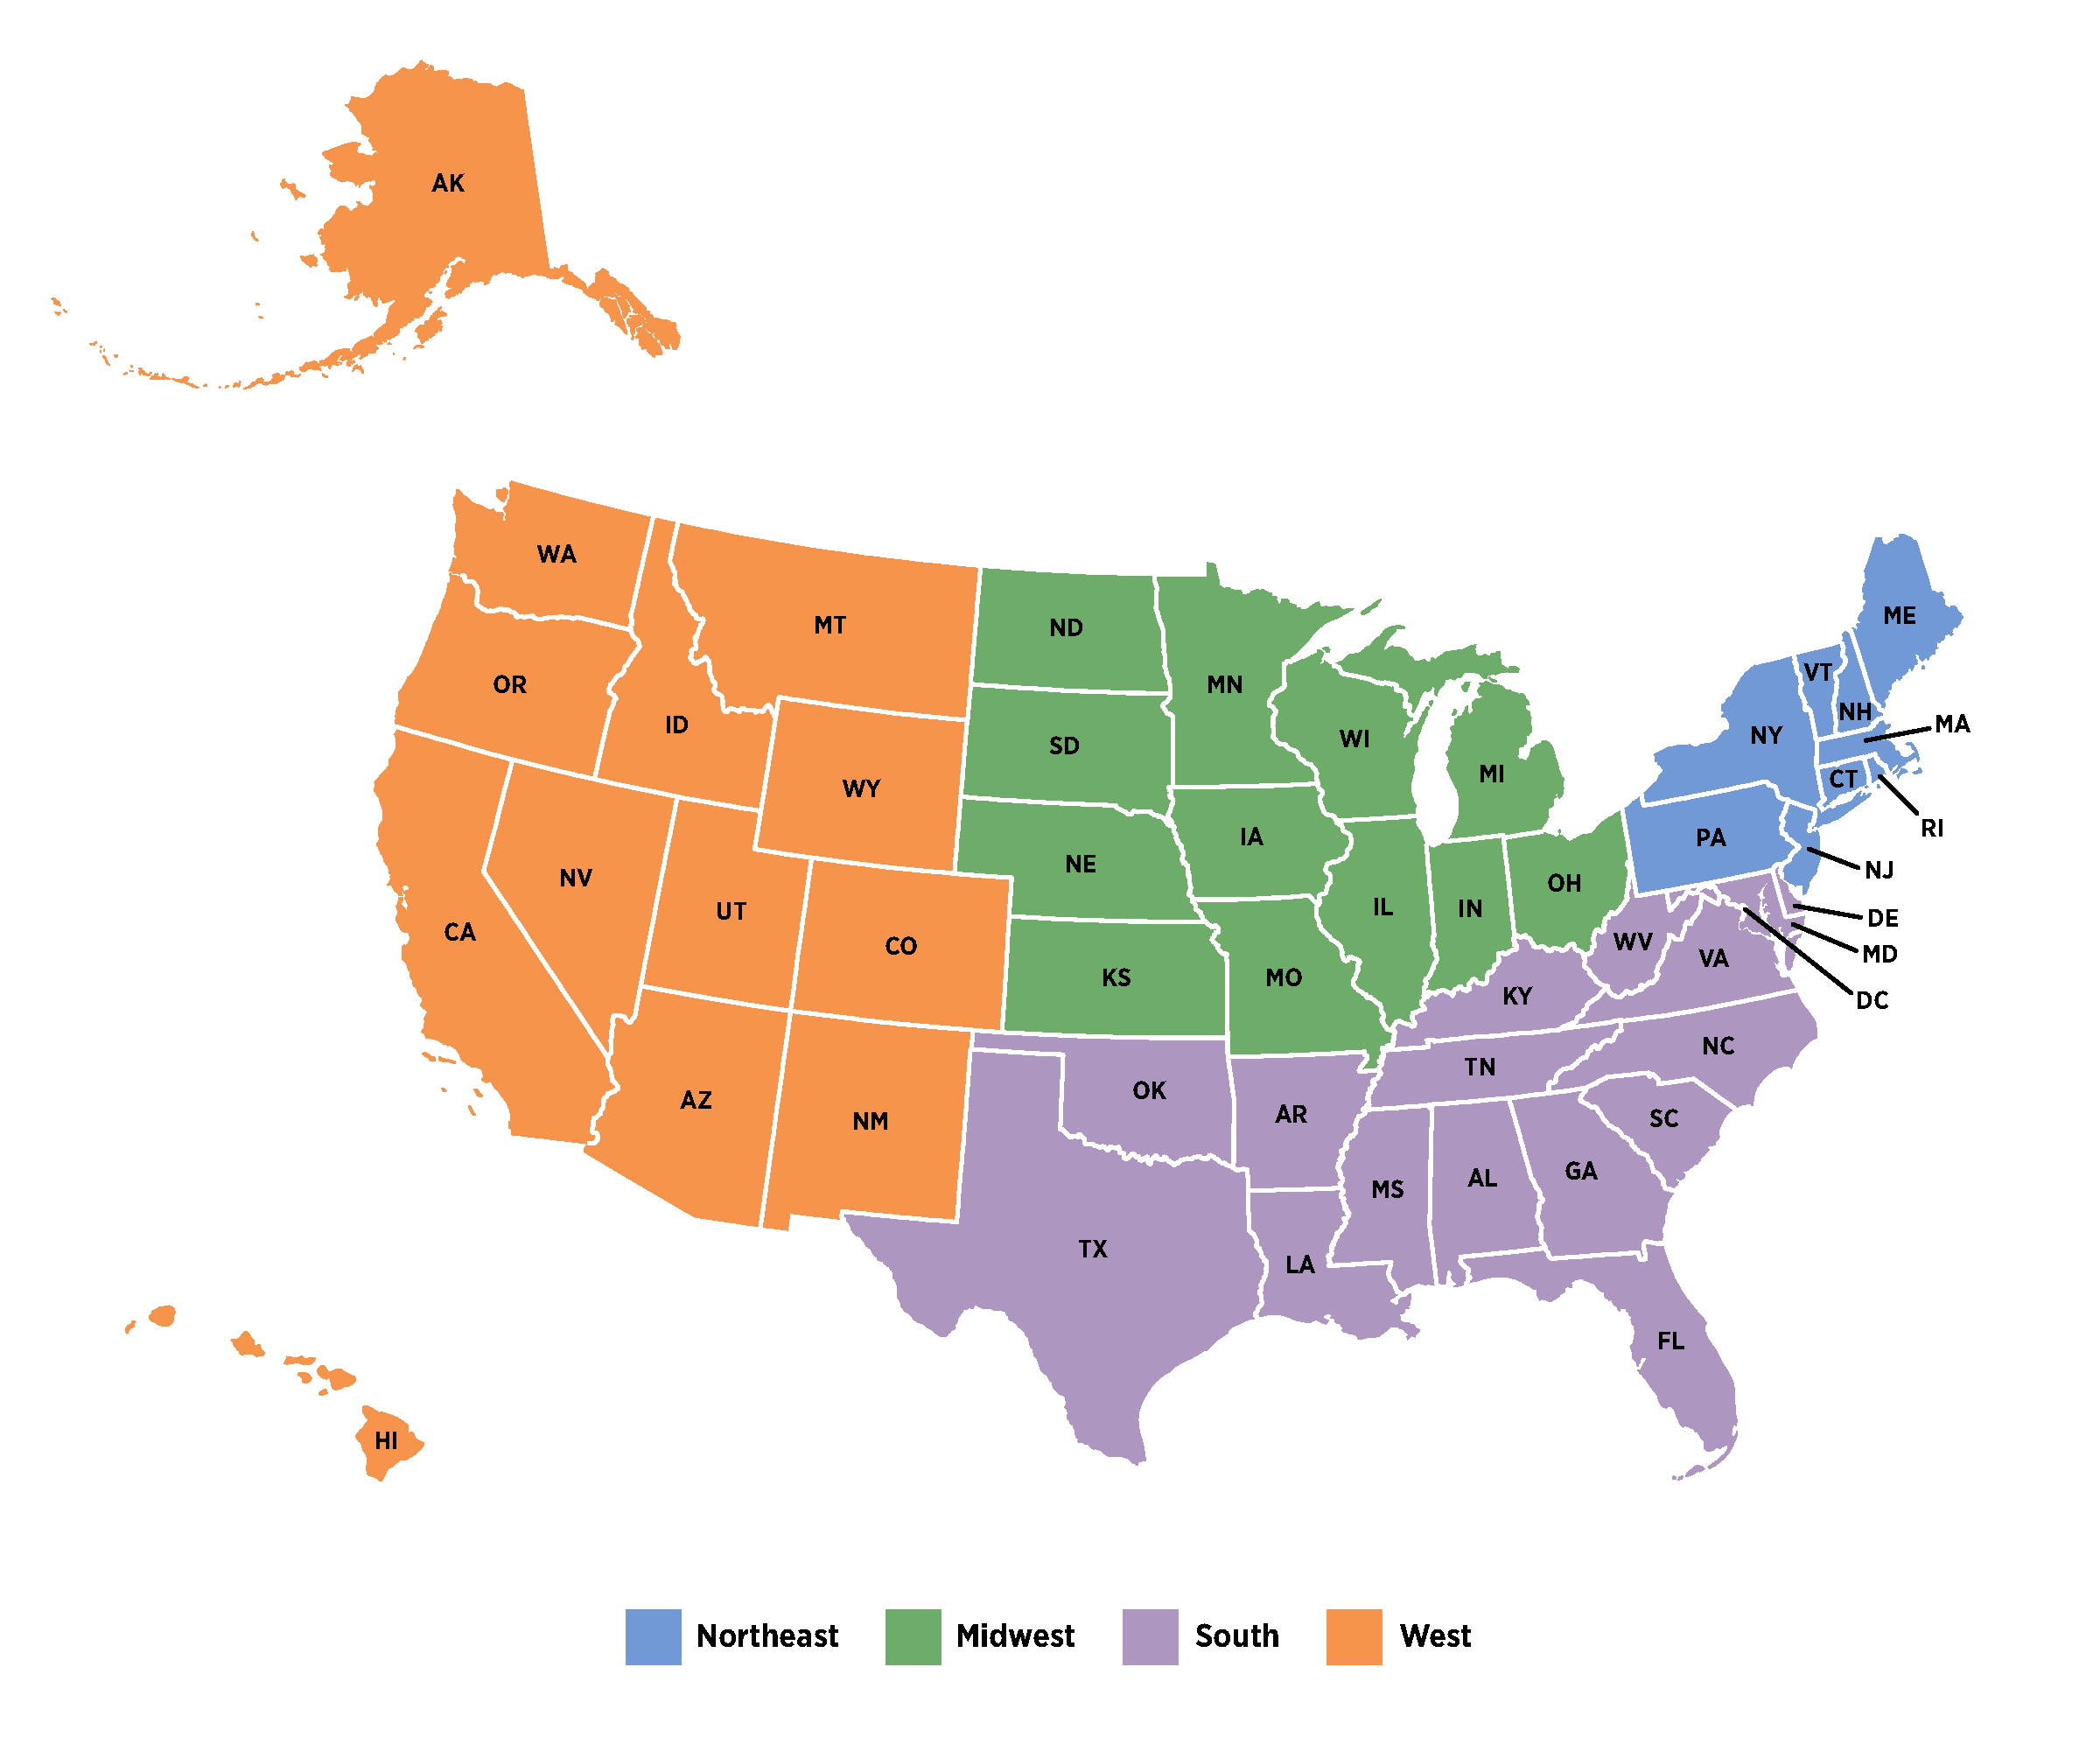
United States by Region
Loading chart...
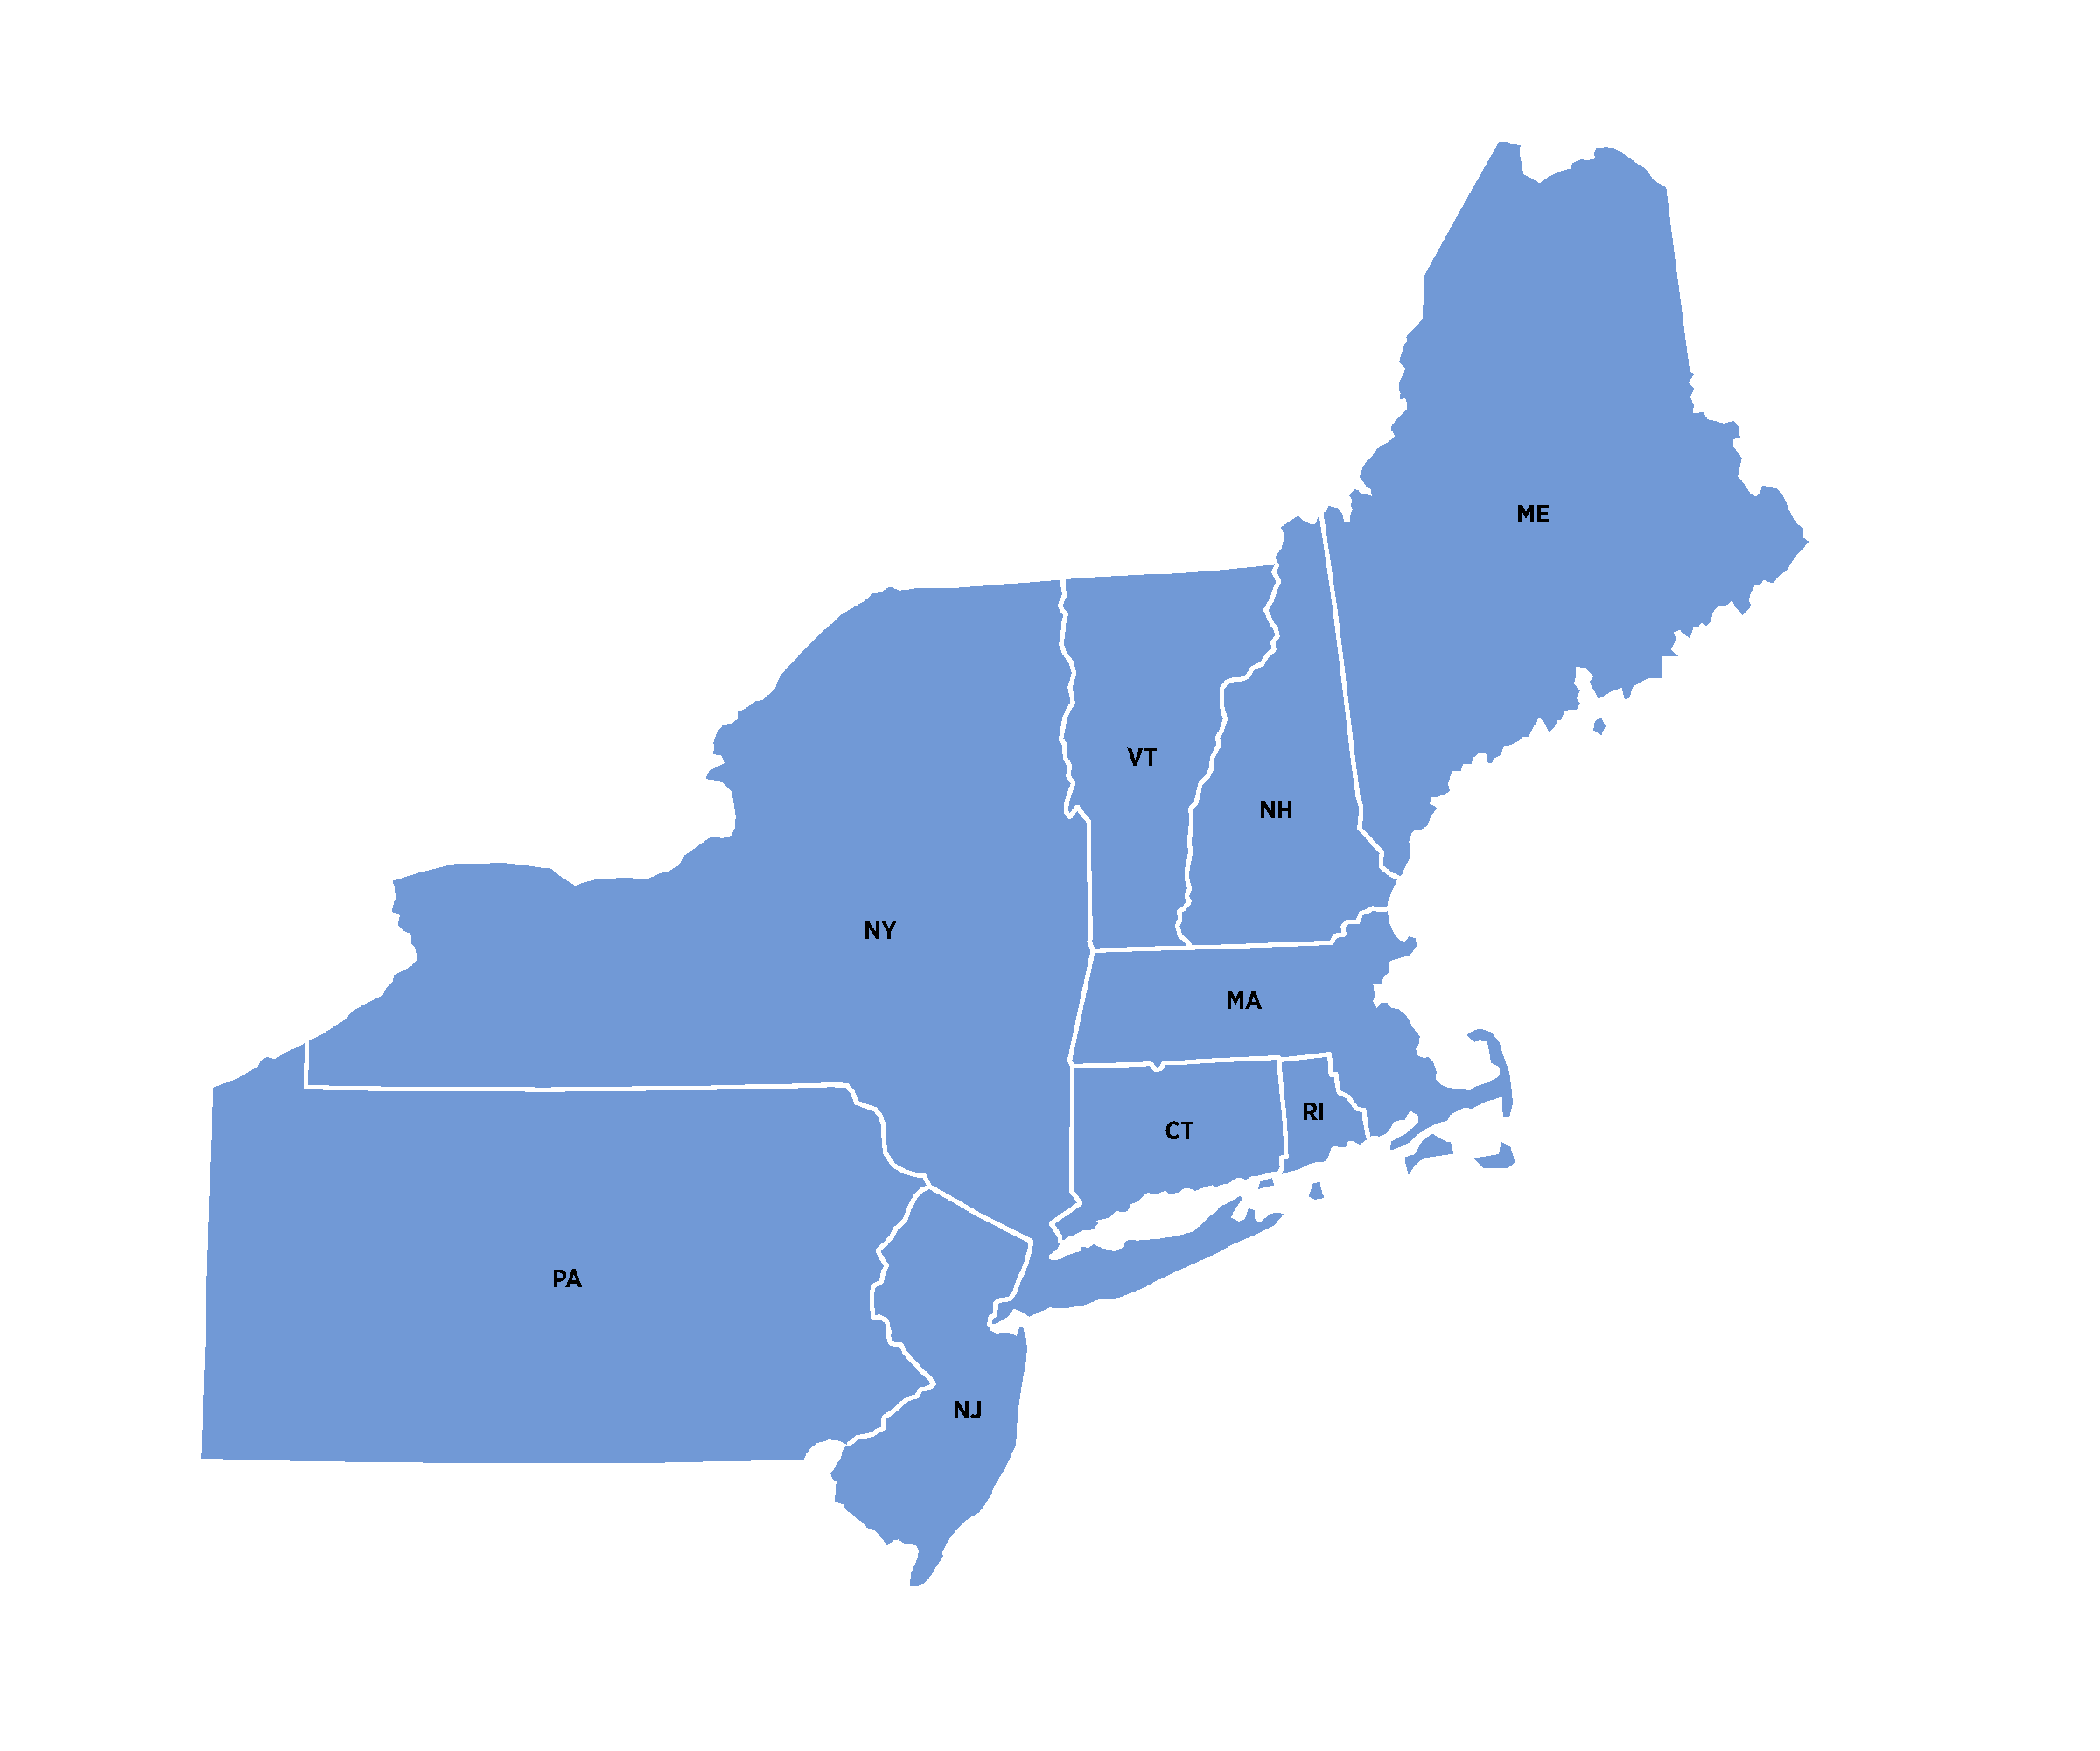
Northeast
Loading chart...
Midwest

Loading chart...
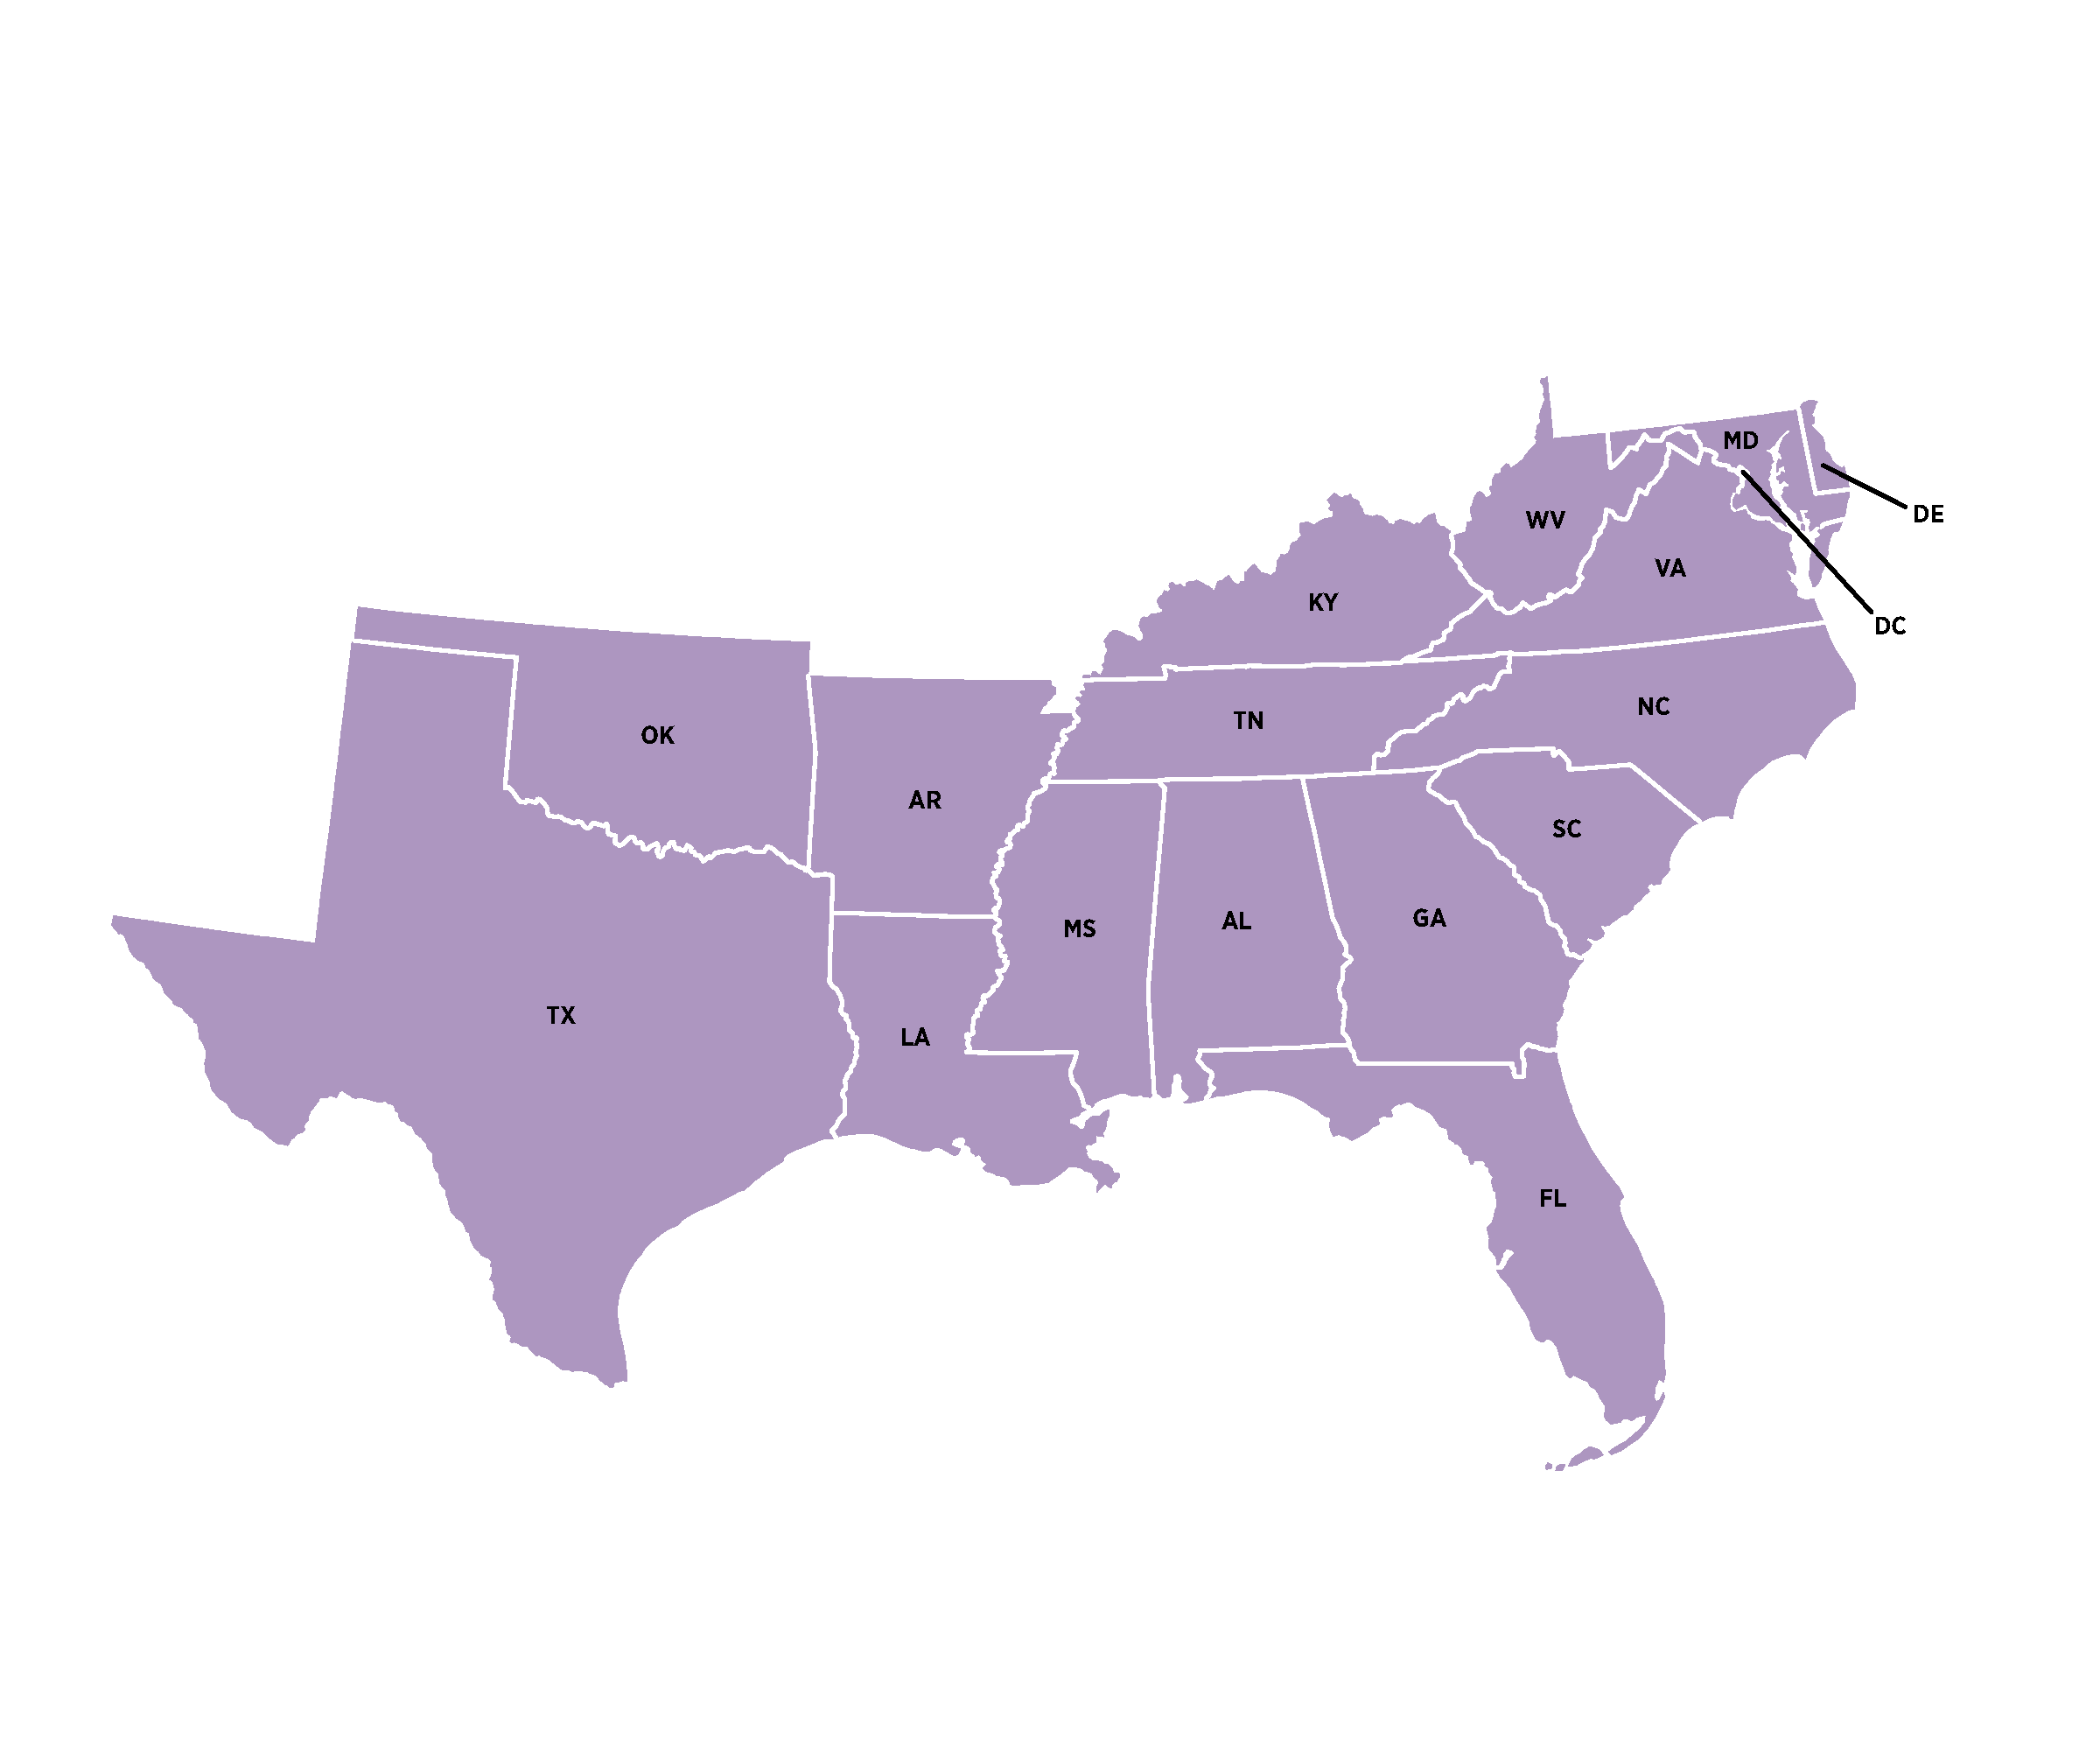
South
Loading chart...
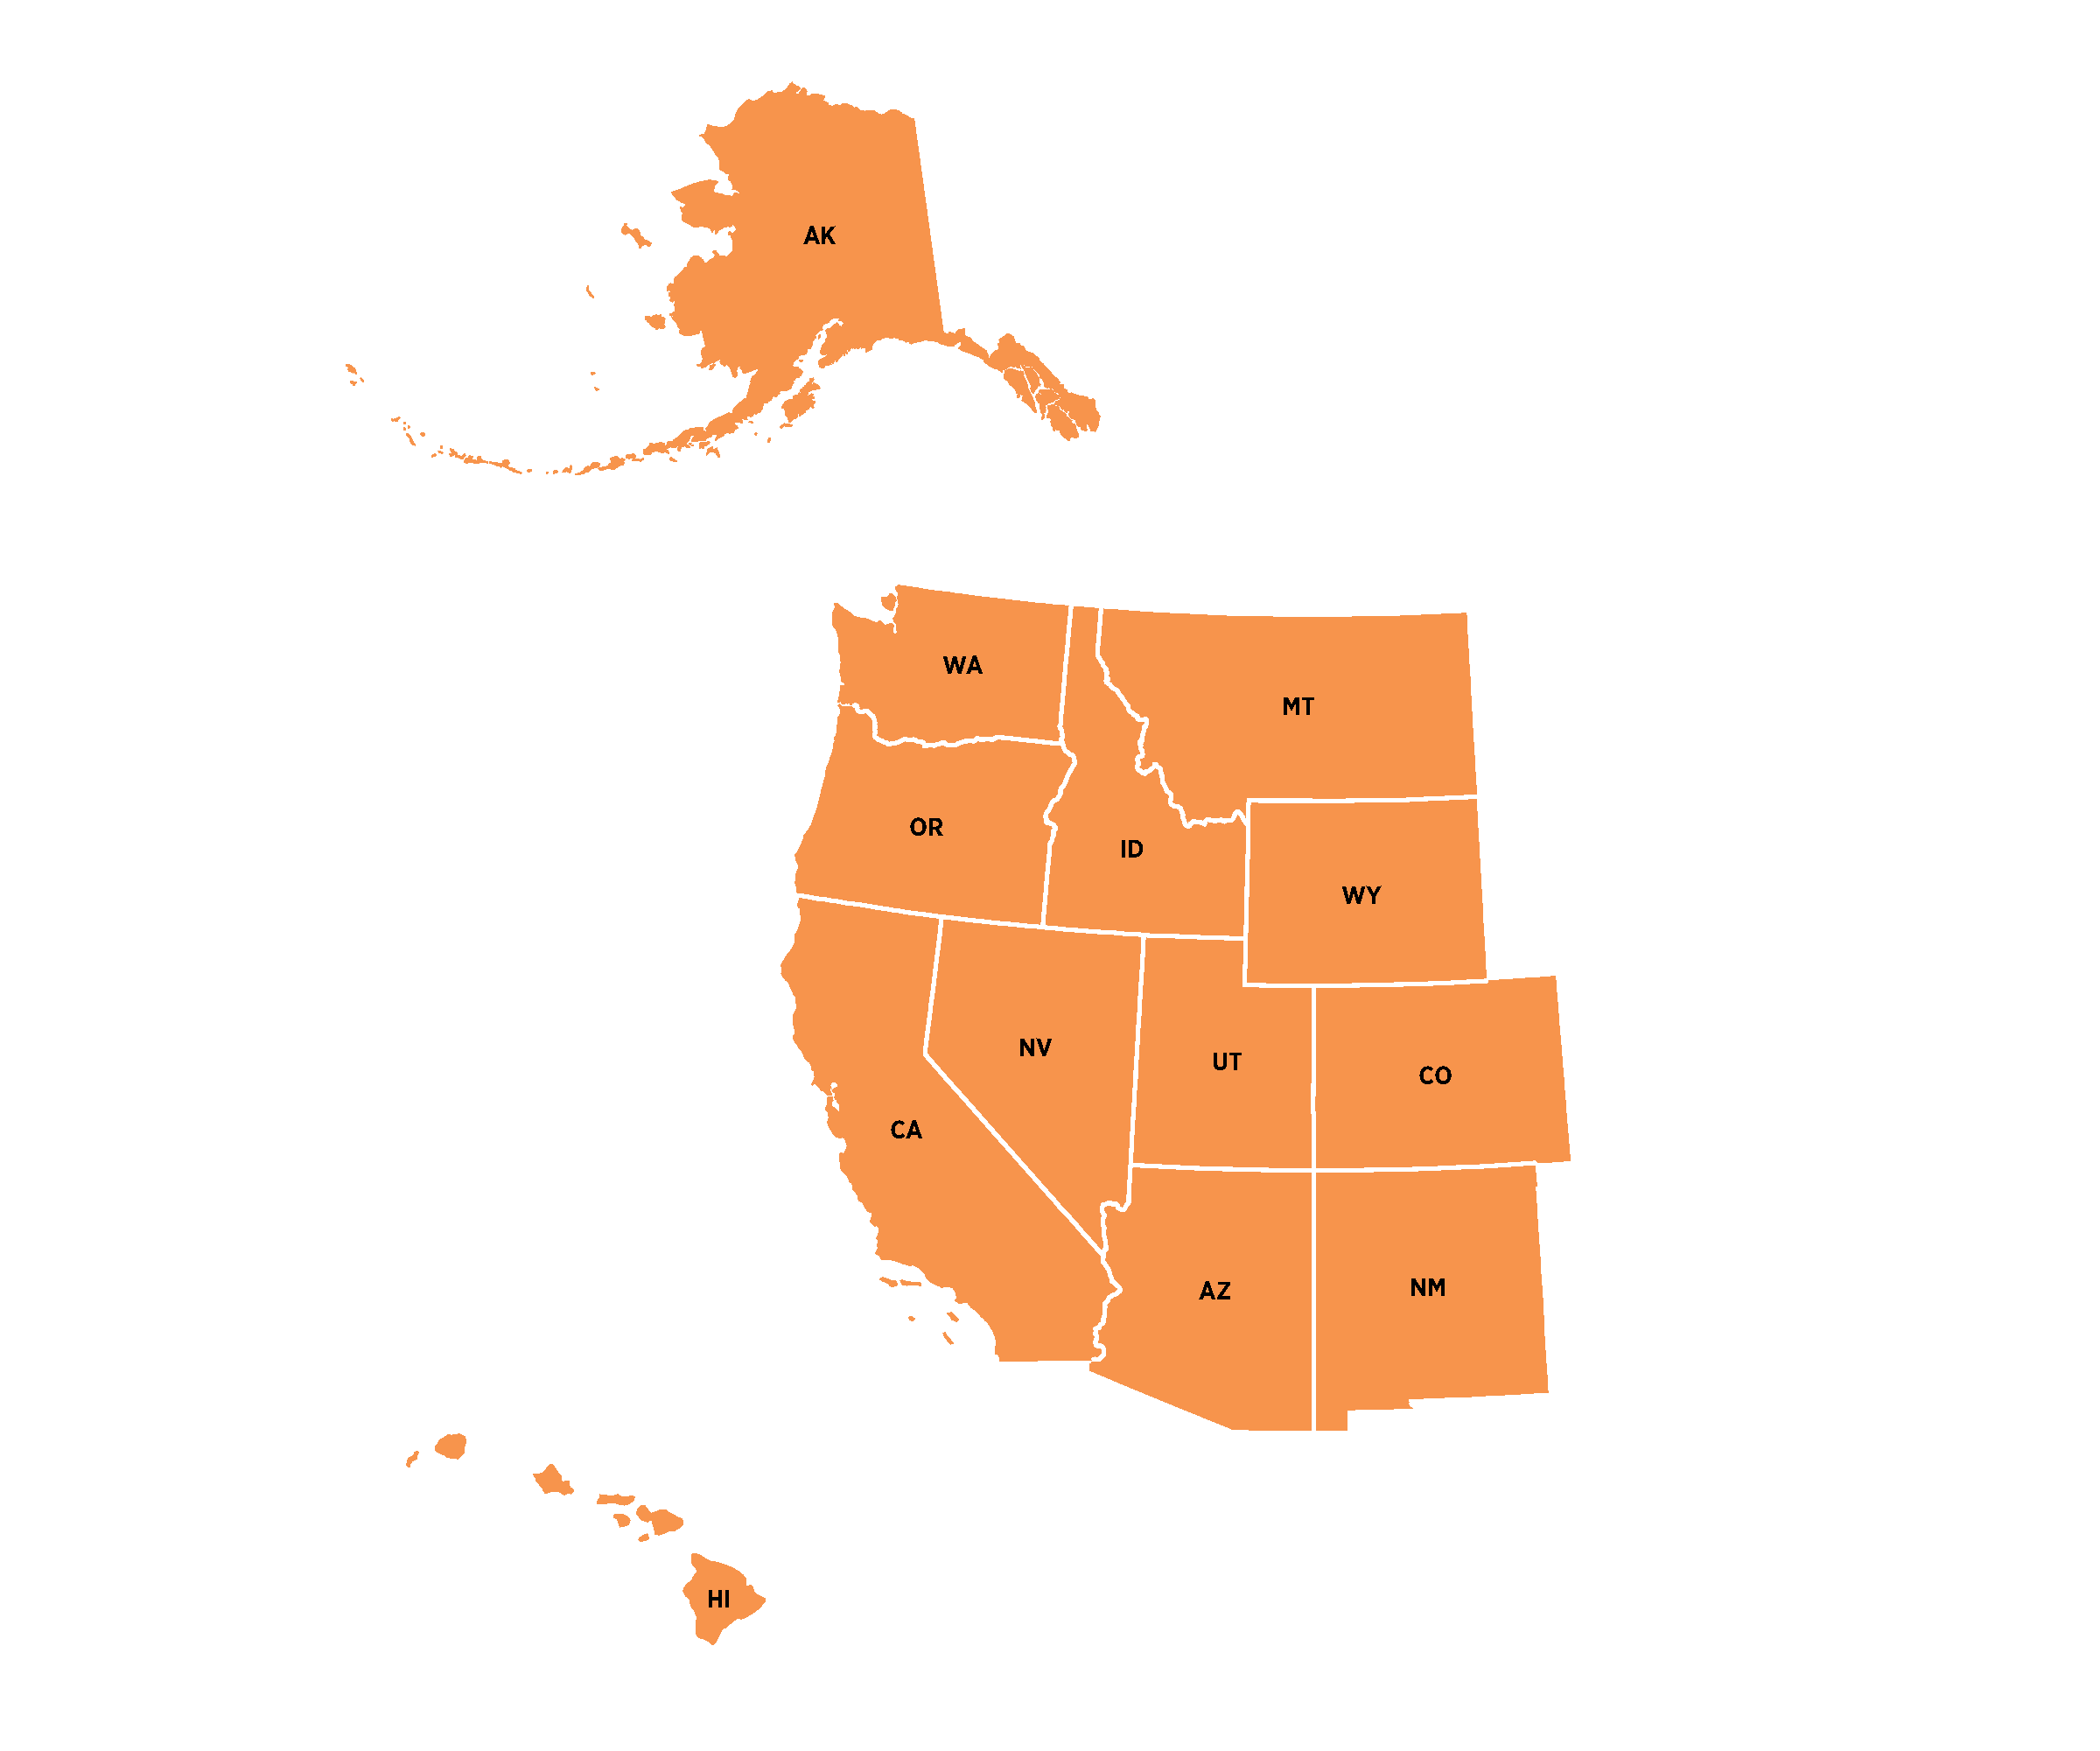
West
Loading chart...
*,†,‡ - The difference between the published estimates is not statistically significant at the 90 percent level.
1 - Unranked due to data suppression at the national level
K - Thousands, M - Millions, B - Billions, T - Trillions
S - Estimate does not meet publication standards
Z - Rounds to zero
Note: Data are based on the 2017 North American Industry Classification System (NAICS). Data are representative of employer firms only for select sectors and subsectors covered in the Annual Integrated Economic Survey (AIES). Data are subject to sampling variability and nonsampling error. Estimates of sampling variability are measured using coefficients of variation (CVs), expressed as percentages and shown in parentheses when hovering over the sector and subsector bars in each chart. Industry order reflects national ranking for the selected measure. Caution should be used in drawing conclusions from the estimates and comparisons shown. "Revenue" represents "Sales, Value of Shipments, or Revenue" in the source data. Information on sector coverage and survey methodology can be found in the AIES technical documentation at https://www.census.gov/programs-surveys/aies/technical-documentation/methodology.html. The U.S. Census Bureau has reviewed the 2023 AIES data products to ensure appropriate access, use, and disclosure avoidance protection of the confidential source data (Project No. P-7529180, and Disclosure Review Board [DRB] approval number: CBDRB-FY25-0362).
