Table View
The table view displays the data in a table, with columns that depend on the selected measures.
Sorting
The header at the top of the table shows the name for each data column. One column will have a small arrow next to the name. The arrow indicates that the table is sorted by that column. If the arrow points up, it is an ascending sort (lowest to highest), and if it points down it is a descending sort. You can sort by a different column or change the sort direction of the currently sorted column by clicking on that section of the header. In the graphic below the table is sorted by the number of uninsured people in descending order.

Filtering
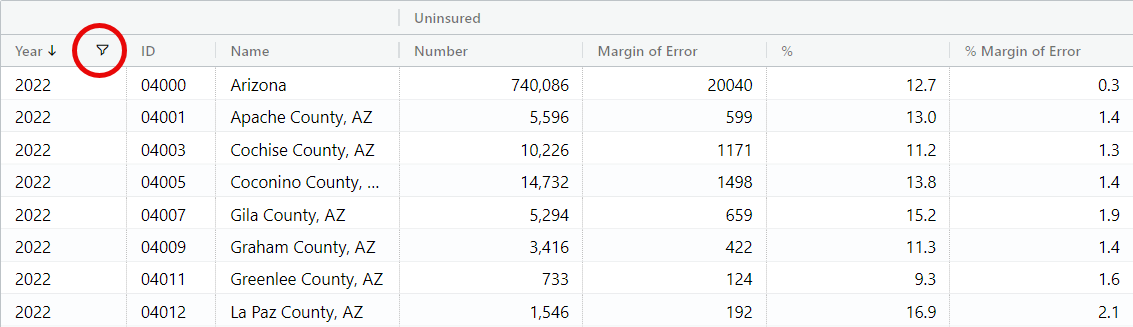
You can filter the years column to include data for one or more years for the geographies you select. To change or add years to the table, select the filter icon as indicated in the graphic below.
Download and Expand View
You can export the grid to CSV or Excel format.
To save, select the download button  ,
and choose CSV or Excel when prompted by the pop-up box.
,
and choose CSV or Excel when prompted by the pop-up box.
To view a larger version of the table, click the expand  button to make the table fill more of the screen. While expanded, click the shrink
 button to return to the smaller view and again show the map
and trend views on the same screen.
button to return to the smaller view and again show the map
and trend views on the same screen.
Right clicking on a cell also allows copying of that cell and optionaly the associated headers.