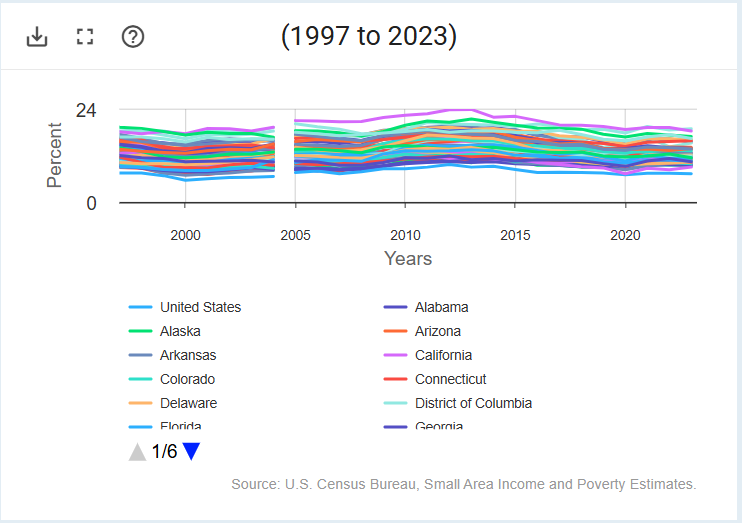
Trends view shows the data on a line graph with time as the x axis. You can filter the data displayed using any of the available filter mechanisms to reduce the number of lines on the graph. There is an upper limit to the number of lines that can be displayed. If that number is exceeded, the "state only" filter may be automatically invoked, and/or you may see a message asking you to select fewer items.
The view has two parts, the graph and the legend.
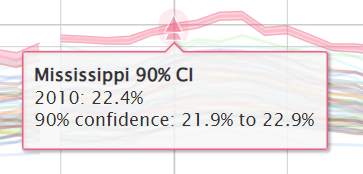
When you move your pointer over a line on the graph, you see a dark text box that identifies the line and the associated data for the nearest point. For example, if you hover over a line on the chart above near 2010 on the x axis, you see the following:
When you click on a label in the legend, the label will gray out and the line will be hidden on the graph. Clicking again on the grayed out label will make the trend line visible again. If the data include a confidence interval, you will see the confidence interval for that line as a shaded area.
In some datasets, such as the one in this example, you will see a gap between two years. This signifies that there was a change that makes comparability across those years problematic. The Small Area Income and Poverty Estimates (SAIPE) modeled estimates were based on the Current Population Survey's Annual Social and Economic Supplement (CPS-ASES) through 2004, and the American Community Survey (ACS) starting in 2005. The ACS is a much larger survey, which accounts for the narrower confidence interval.
You can print the trend graph, export it to PDF format, or save it as an image, using the buttons above the top left of the map.
To save as an image  , choose PDF or JPEG in the download menu. You will get a new window or tab with an image
that shows only the table part of the page. Right-click the image to save it. Depending on
your browser, your choice of file formats may be limited and may not include JPG. PNG is another common graphics format, usable almost
anywhere JPG is usable.
, choose PDF or JPEG in the download menu. You will get a new window or tab with an image
that shows only the table part of the page. Right-click the image to save it. Depending on
your browser, your choice of file formats may be limited and may not include JPG. PNG is another common graphics format, usable almost
anywhere JPG is usable.
Click the expand  button to
make the trend graph to fill more of the screen. Or while expanded
click the shrink
button to
make the trend graph to fill more of the screen. Or while expanded
click the shrink  button to make it smaller and
show the map and grid as well on the same screen.
button to make it smaller and
show the map and grid as well on the same screen.