Survey of Income and Program Participation (SIPP) Codebook Help
Controls
Clear Filters Icon

The Clear Filters icon resets SIPP Codebook to its default settings.
Sorting Icons

Sort by Variable or Topic, either ascending or descending, by using the select lists in the dark blue toolbar row.
Default
sorting is by Variable, Ascending. Subtopic is always sorted in ascending order.
Mini Codebooks, Download, and Feedback Icons

-
 Mini Codebook: Click this button and a dialog box will appear to select the year of mini codebook
PDF to download. Mini codebooks contain
the following fields only: Variable Name, Description and Survey Year, grouped by Topic and Subtopic
-
 Downloads: Download your current results view in either PDF or CSV format. The data downloaded
will
reflect any filters you may have set, and will contain all fields for each variable shown on your screen. Please
be aware that CSV downloads opened in Excel apply auto-formatting and values may not display correctly. It may be
helpful to use Excel's Text Import Wizard.
-
 Feedback: Displays a message box that provides an email. This email allows you to provide
feedback on the application (what you like, what you don't like, bugs, etc.)
Browse Variable Name or Topic Search

Browse Variable Name or Topic Search searches on the following fields: Variable, Description, Topic and Subtopic.
Press enter to search. To clear your search text, click the 'x' displayed to the right of your text.
The search has been dynamically configured so that filters now "listen" to the keyword search, allowing the user to
select only filter options valid within that search. The user can then further narrow the results using the filters.
Note - If a user first sets filters and then conducts a keyword search in which
no results are found, the filters are automatically cleared and the keyword search is tried a second time,
attempting to find results anywhere in the unfiltered data.
When this happens, the following message is displayed at the top of the page: 'No results. Search tried again
without filters.'
Filters

Survey Year, Topic/Subtopic or Variable Name:
- Survey Year Filter
- Contains the complete list of Years and waves available, years sorted in descending order. Check one or more
years/waves
and click the Apply button to filter the results. The Clear button will deselect all previously-made selections.
- Topic/Subtopic Filter
- Contains the complete list of Topics and Subtopics available, sorted in ascending order. Checking a Topic will
select
all of its Subtopics. Checking one or more Topics or Subtopics and clicking the Apply button will filter the
results. The Clear button will deselect all previously-made selections.
- Variable Name Filter
- Contains a list of every variable, sorted in ascending order. Check one or more variables here and click the
Apply
button to filter the results. The Clear button will deselect all previously-made selections. In order to quickly
find the variable you are searching for, you may search for a variable name in the “Filter Options” search box.
Results View
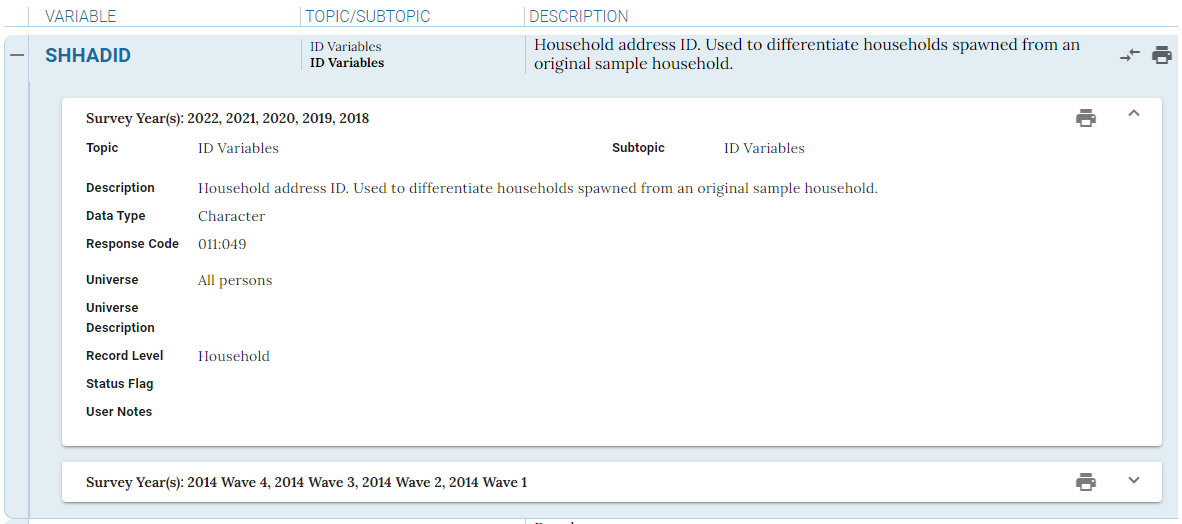
Summary Header

Displays Variable Name, Topic/Subtopic and Description for each selected variable. Clicking the print icon will
print this variable and its details for all years available.
Detail View

This is the expanded view for the variable and contains all fields available for that variable. You may see
multiple year groupings within this expanded view. The first year grouping will be expanded, with subsequent year groupings
collapsed. This indicates that there are differences in data between the year groupings. You may expand or collapse
year groupings by clicking the arrow located to the right of the group of years displayed. Below are the Record
Level definitions for each value displayed. Clicking the print icon will print this variable’s details for this expanded
year-grouping only.
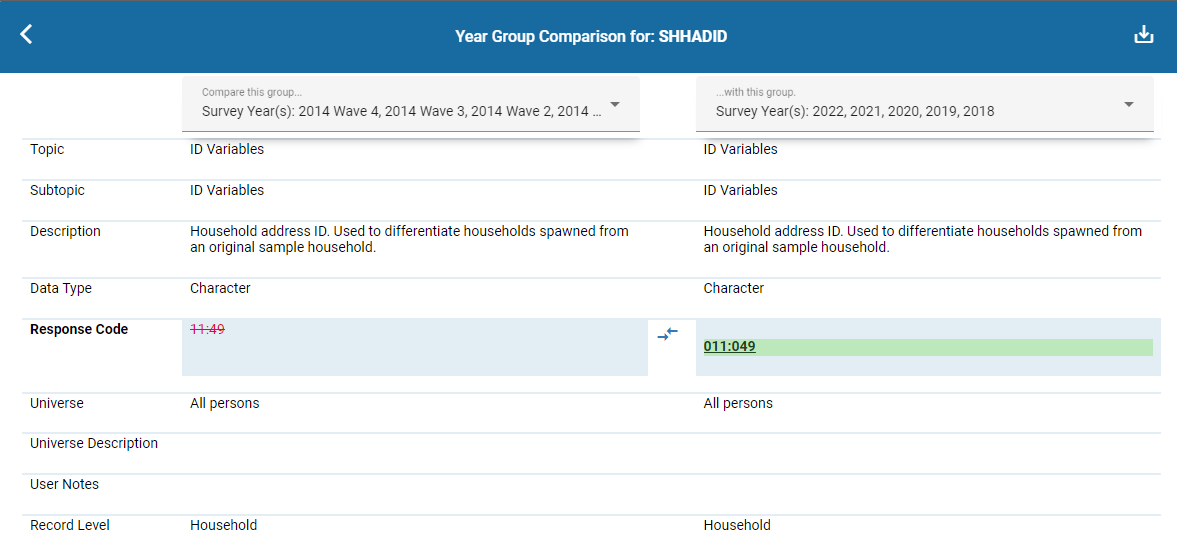
Comparison View

By clicking the comparison icon to the left of the print icon, you can compare the differences between a variable's year groups.

In this view, you can see the differences between two year groups of a variable. To choose the specific year groups you wish to compare,
select them from the drop-down menus at the top of the columns. Any field that has changed between the two year groups will be highlighted;
any differences from the left year group will appear red and struck-through, while any differences to the right year group will appear bold, underlined,
and with a green background.
This comparison can be saved as a PDF document by pressing the save icon in the upper-right corner of the screen. To go back, either hit the
back button in the upper-left of the screen, or hit escape on your keyboard.
SIPP Data
The SIPP public-use data file is released at the person-month level; however, variables included on the file do not
necessarily
vary by month for persons. The Record Level field identifies how the data were processed. Please use the definitions
below to see
how each variable was processed.
- Household = Data processed at the household level. Variable's values do not vary among
household members. Each household member will have the same value for the variable on all person-month records.
- Person = Data processed at the person level. Variable's values may vary among persons but not months. Each
person will have the same value for the variable on all person-month records.
- Person-month = Data processed at the person-month level. Variable's values may vary by month for persons. Each
person may have a different value for the variable on each person-month record.
When topcoding select variables, outliers at the top of the distribution are replaced by the mean or median of the
selected outlier values. Each variable has a set of corresponding summary statistic variables that display
additional information about the distribution of topcoded values. These variables end in _MEAN (mean), _MED
(median), and _STD (standard deviation) and are only in universe for topcoded cases. The Record Level field for
these corresponding summary statistic variables is the same as the topcoded counterpart, but users should note most
summary statistic variables contain one value for all topcoded cases; there is no variation between in-universe
cases.
Status Flag Variables
Nearly all variables on the SIPP data file have a corresponding “status flag” variable prefixed with an “A”. These
variables detail whether the corresponding variable’s value for a given record was reported, imputed, or assigned.
Possible status flag values are listed on the table below.
| Status Flag Value |
Meaning |
Description |
| 0 |
Not in universe |
The item is not imputed, and no data were reported by the respondents. |
| 1 |
In universe, as reported |
The item is not imputed, and data were reported by the respondents. |
| 2 |
Statistical imputation (hot-deck) |
The item is imputed from hot-deck imputation. |
| 3 |
Logical imputation |
The item is imputed logically. |
| 4 |
Model-based imputation |
The item has gone through a model-based imputation procedure. |
| 5 |
Cold-deck value imputation |
The item is imputed to a cold-deck value. This cold-deck value is what each cell in the hot-deck matrix gets
initialized to. It is the most common reported value a respondent would be likely to report for that
particular cell. So, if an item could not get a hot-deck value, this initialized value is used to set the
value for that item. |
| 6 |
Imputed from a range |
The item is imputed based on a range. |
| 7 |
Combination of 1 and 2/3/5/6 |
The item is imputed using reported value and any combination of imputation method values 2, 3, 5, and 6
(described above). |
| 8 |
Combination of 2/3/5/6 |
The item is imputed using any combination of imputation method value 2, 3, 5, and 6 (described above). |
| 9 |
Can be determined from the status flags for the components of this recode |
The item is a recoded variable created using other variables in the data. |
SIPP Crosswalks
Some variables' names may change over time. To view these changes, please consult the crosswalk spreadsheets for
each survey year on the Crosswalks page.
Pre-2014 SIPP Metadata
Please see the SIPP website's Data
Dictionaries page for pre-2014 Panel metadata.
SIPP Data User Notes
Please click on the link below to view all user notes associated with the SIPP data. These user notes communicate
resolutions or updates necessary to assist data users and provide the highest quality of data possible.
SIPP Technical Documentation User Notes
 Mini Codebook: Click this button and a dialog box will appear to select the year of mini codebook
PDF to download. Mini codebooks contain
the following fields only: Variable Name, Description and Survey Year, grouped by Topic and Subtopic
 Downloads: Download your current results view in either PDF or CSV format. The data downloaded
will
reflect any filters you may have set, and will contain all fields for each variable shown on your screen. Please
be aware that CSV downloads opened in Excel apply auto-formatting and values may not display correctly. It may be
helpful to use Excel's Text Import Wizard.


