
Official websites use .gov
A .gov website belongs to an official government organization in the United States.
Secure .gov websites use HTTPS
A lock (
) or https:// means you’ve safely connected to the .gov website. Share sensitive information only on official, secure websites.

Topics
Data & Maps
Surveys & Programs
Resource Library

Making Sure Economic Comparisons Over Time Are Accurate, Not Just a Result of Changes in Classifications and Geography
Is an industry in a particular area growing, remaining stable or declining?
Determining how an industry is changing over time is critical when making business decisions. But how do you measure change over time accurately if the North American Industry Classification System (NAICS) that the data are based on has changed?
To ensure everyone can make solid, apple-to-apple comparisons, the U.S. Census Bureau just released the 2017 Economic Census Comparative Statistics and Bridge Statistics reports.
What if the city boundaries of the area you’re interested in have expanded? In both cases, the economic growth could be real or inflated because the industry classification or geographic area is different.
To ensure everyone can make solid, apple-to-apple comparisons, the U.S. Census Bureau just released the 2017 Economic Census Comparative Statistics and Bridge Statistics reports.
Comparing and Bridging Data
The Comparative Statistics report presents data for both 2017 and 2012 using 2012 NAICS codes. Tabulating these two years of data based on the same NAICS codes ensures accurate time comparisons.
In addition, the Bridge Statistics report lists 2017 data for industries that were impacted by a NAICS code change in 2017.
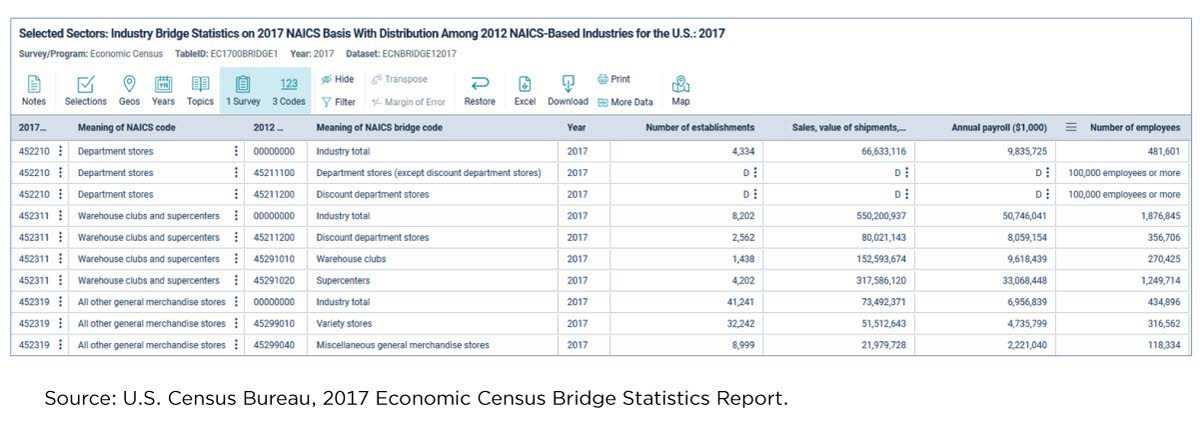
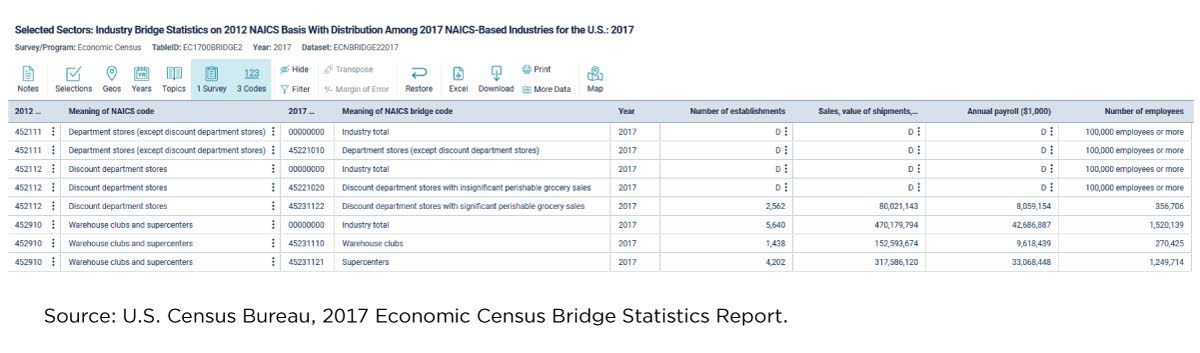
The Bridge Statistics report presents data in two separate files. The first file presents data using the 2017 NAICS codes and shows their corresponding 2012 NAICS codes. The second presents data using the 2012 NAICS codes, showing their corresponding 2017 NAICS codes.
How Have NAICS Codes Changed?
The 2017 Bridge Statistics Report shows four ways NAICS codes have changed since the 2012 Economic Census:
- “One-to-one” changes. This is when the contents of the industry on the 2017 and 2012 NAICS basis remain the same but the NAICS code itself changes. For example, Home Health Equipment Rental businesses were classified in 2012 NAICS 532291 and now are in 2017 NAICS 532283.
- “Many-to-one” changes. This is when two or more industries are combined into one. For example, Household Cooking Appliance Manufacturing, Household Refrigerator and Home Freezer Manufacturing, Household Laundry Equipment Manufacturing, and Other Major Household Appliance Manufacturing were in 2012 NAICS codes 335221, 335222, 335224 and 335228, respectively, and are now combined in one Major Household Appliance Manufacturing classification — 2017 NAICS code 335220.
- “One-to-many” changes. This is when a single industry is broken out into two or more new industries. There were no 2017 NAICS changes in this scenario but it happened between the 2007 and 2012 economic censuses. One category, Other Electric Power Generation, was split into five new industries within NAICS 22111 (Electric Power Generation, Transmission and Distribution): Solar, Wind, Geothermal, Biomass, and Other Electric Power Generation to recognize growth of these industries over time.
- “Many-to-many” changes. This is when two or more industries or parts of industries are combined to form two or more new industries. These are the most complex changes made, as we detail below.
“Many-to-Many” NAICS Changes
If we simply downloaded the data from the 2012 and 2017 Economic Census for Warehouse Clubs and Supercenters (2017 NAICS 452311) based upon the industry title alone, we may think that the industry group is the same in 2012 and 2017.
However, the NAICS codes for this industry in 2012 and 2017 are different — an indication that something has changed.
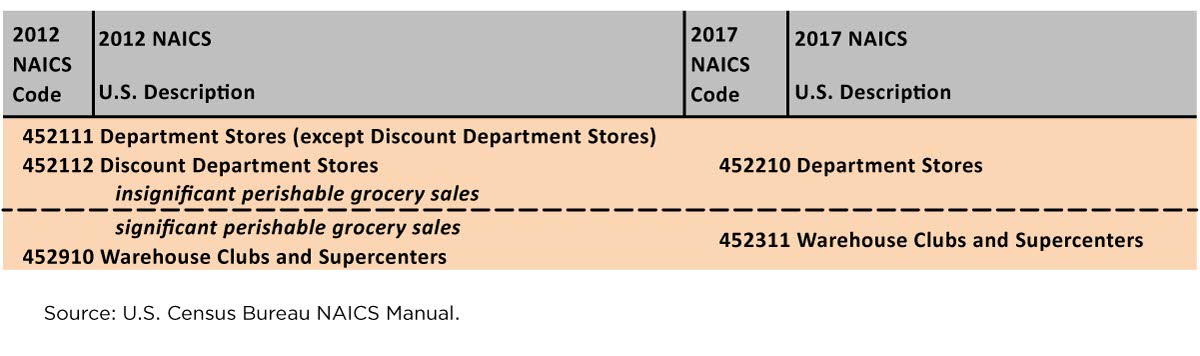
The table below shows the relationship between the 2017 NAICS codes and their corresponding 2012 NAICS codes for Warehouse Clubs and Supercenters and other related industries. Reading the definition of this industry in the 2017 NAICS Manual, we can observe that it now includes Discount Department Stores that sell a significant amount of perishable groceries.
We would also note that the 2017 Department Stores industry now includes Discount Department Stores that sell an insignificant amount of perishable groceries.
And that’s not all. The 2012 industry for Discount Department Stores is now gone for 2017.
As helpful as this NAICS information is, it doesn’t tell us anything about the magnitude of the change. It doesn’t show how much of the growth in Warehouse Clubs is “real” growth as opposed to growth that is due to NAICS change.
And that’s where the Comparative and Bridge Statistics reports reign supreme.
They show us that sales of Warehouse Clubs and Supercenters based on the 2012 NAICS definition grew from $406.3 billion in 2012 to $470.2 billion in 2017, a 15.7% increase.
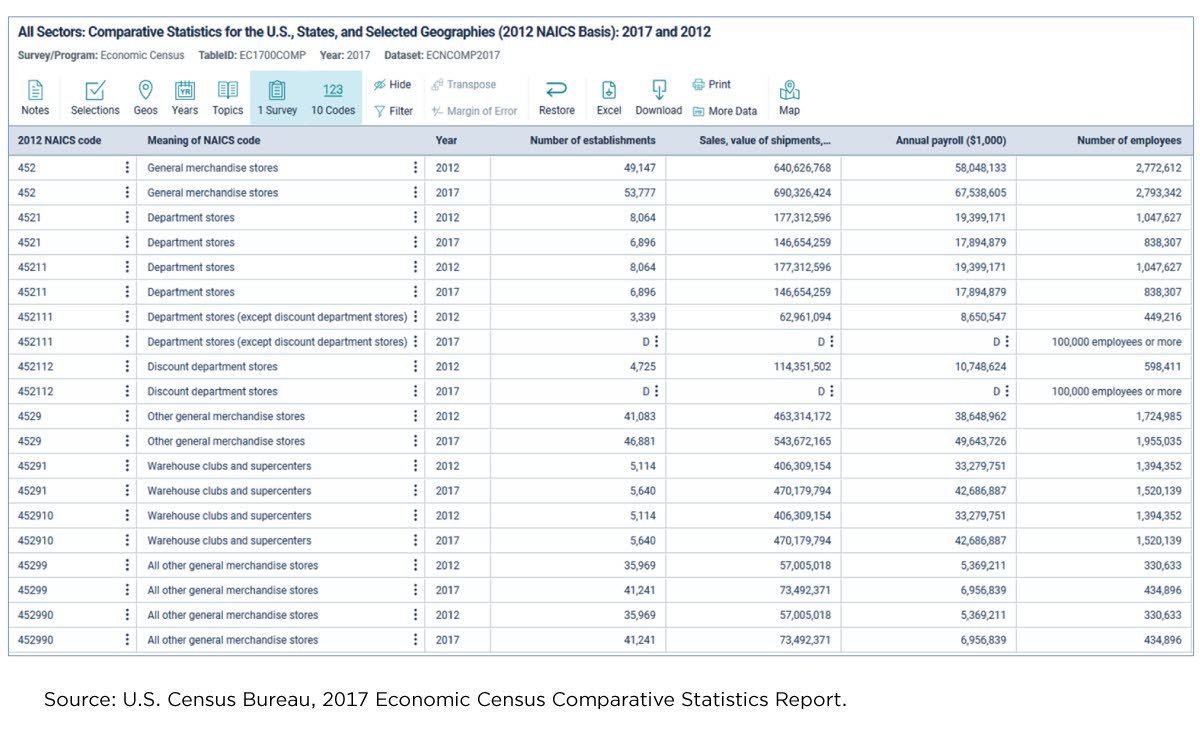
Had we looked only at the data published in 2012 and 2017 data tables separately, based on the industry title, sales of Warehouse Clubs and Supercenters would seem to have increased 35.4%, from $406.3 billion in 2012 to $550.2 billion in 2017.
However, the Bridge Statistics Report (below) would show that $80.0 billion of that $550.2 billion actually came from Discount Department Stores that had a significant amount of perishable grocery sales.
For this industry, the NAICS change made up a significant portion of the increase: 19.7% of the overall 35.4% increase.
Selected Findings From the Comparative Statistics Report
For a one-stop guide to comparable data, go to the Comparative Statistics report. It not only presents data for 2017 and 2012 for 6-digit coded industries that have been impacted by a NAICS change, but for all 2- through 6-digit coded industries.
Some selected findings for different industries:
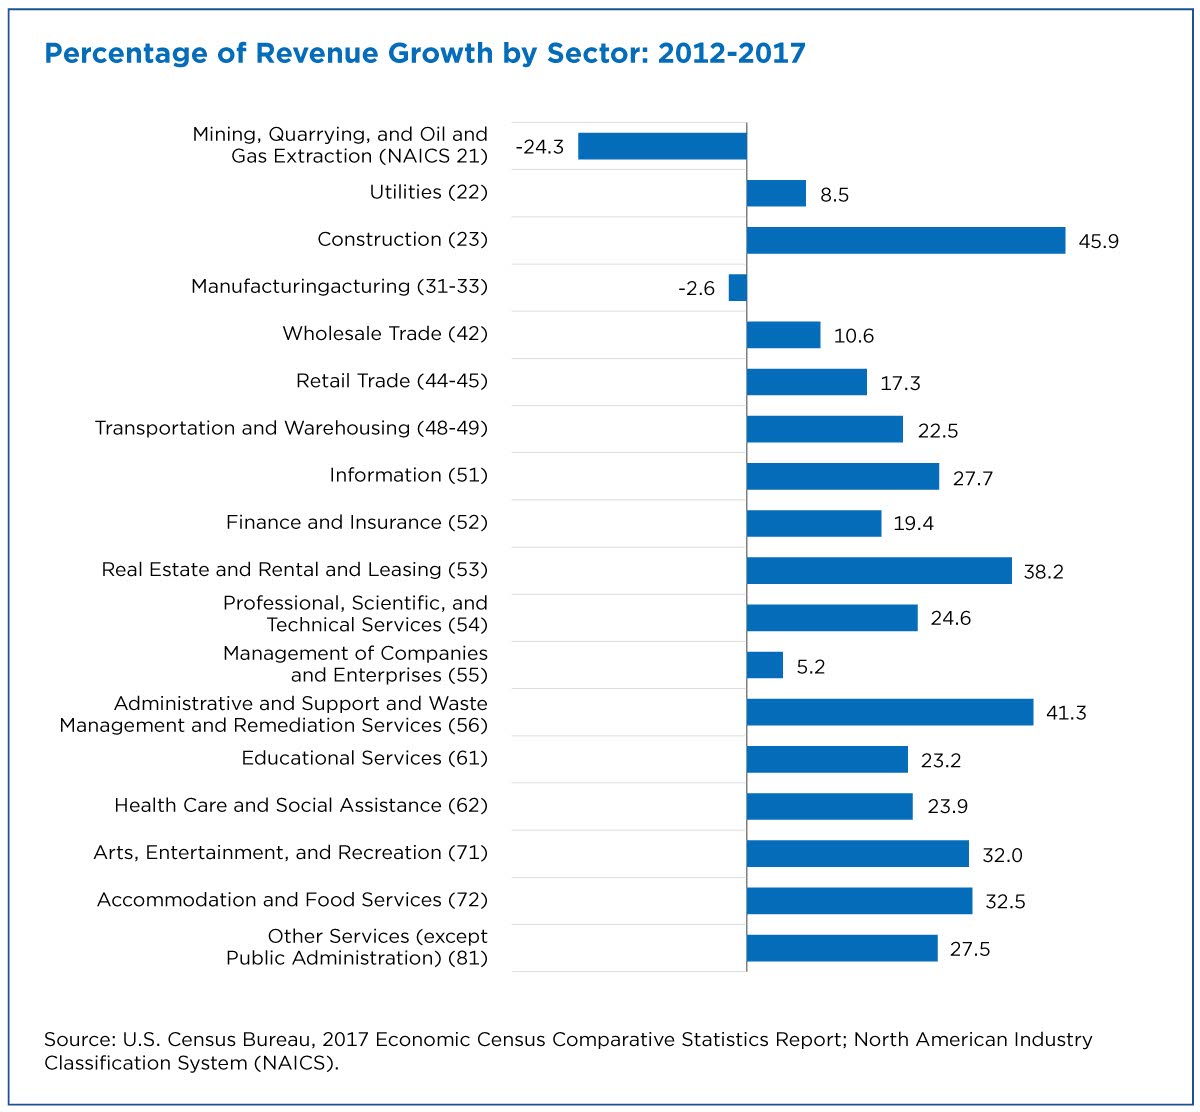
- The Construction sector (NAICS 23) saw the largest increase in the number of establishments from 2012 to 2017 (up 45.9%). The Administrative and Support and Waste Management and Remediation Services sector (NAICS 56) was ranked second at 41.3%.
- Drugs and Druggists’ Sundries Merchant Wholesalers (NAICS 4242) generated $931.7 billion in sales in 2017. That was a 36.1% increase from 2012. It was the third largest 4-digit industry group in the Wholesale Trade sector in 2017.
- Internet Publishing and Broadcasting and Web Search Portals (NAICS 519130) grew 88.1% in sales from 2012 to 2017, while Newspaper Publishers (NAICS 511110) declined 12.7%.
- Fitness and Recreational Sports Centers (NAICS 713940) grew 37.4% from 2012 to 2017. It shows that despite all the home gym equipment on the market, Americans still love to join fitness centers.
Understanding the comparability of the data between each NAICS vintage helps businesses make informed decisions.
The Comparative and Bridge Statistics reports help us determine if the economic growth we observe in our communities and industries is real or a result of industry classification and other statistical changes. Without that information, business owners would have a difficult time making sound investment decisions that can help their businesses and their communities grow.
Note: All dollar values are expressed in current dollars, i.e., they are not adjusted for price changes. The Economic Census website provides more information on privacy, the symbols presented in this story and statistical methodology.
Tara Dryden is a survey statistician in the Census Bureau’s Economy Wide Statistics Division.
Andrew Hait is a Census Bureau economist.
Story Ideas and Statistics
Stats for Stories
National Manufacturing Day: October 6, 2023
The U.S. Census Bureau joins a group of public and private organizations in celebrating the importance of the manufacturing sector of the nation’s economy.
Manufacturing Week
The U.S. Census Bureau joins the celebration by providing a week's worth of rich content, including statistics that inform businesses and policymakers.
America Counts Story
2017 Economic Census Data Breaks Out Industry Growth, Changes By State
State and local data from the Census Bureau’s 2017 Economic Census provide insight into the businesses that are vital to our economy.
America Counts Story
Business Growth in Desert Southwest More than Twice National Average
More than 287,000 employer businesses called these counties home in 2019, up 8.5% Since 2015.
America Counts Story
Consumers Turn To Biking for Safe Fun and Exercise During Pandemic
Stay-at-home orders and shuttered fitness clubs amid COVID pandemic up demand for bicycles, leading to bike shortages and higher prices.
Page Last Revised - April 13, 2022
✕
Is this page helpful?
 Yes
Yes
 No
No
 Yes
Yes
 No
No✕
NO THANKS
255 characters maximum
 255 characters maximum reached
✕
Thank you for your feedback.
Comments or suggestions?

Comments or suggestions?