Administrative Professionals Day Recognizes 2% of U.S. Workforce, Mostly Women Who Earn Less Than Average Worker
One of the five most common occupations for women is working as secretaries and administrative assistants and on April 27, Administrative Professionals Day recognizes this workforce of 2.78 million workers.
Who are the people who keep many U.S. business and office operations running smoothly? Most are women (94%), from secretaries and medical or legal administrative assistants to executive secretaries and administrative assistants who as a group in 2019 earned below-average wages: $41,150 compared to the national average of $50,078.
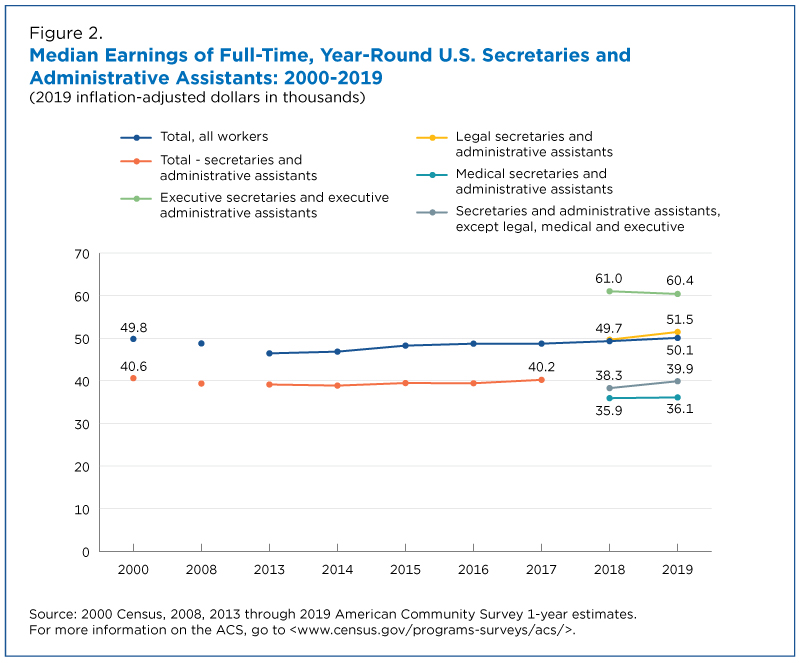
Median earnings of secretaries and administrative assistants remained around $40,000 from 2000 to 2019 (in 2019 inflation-adjusted dollars), between $7,000 and $9,500 less than what the average worker in the United State earned.
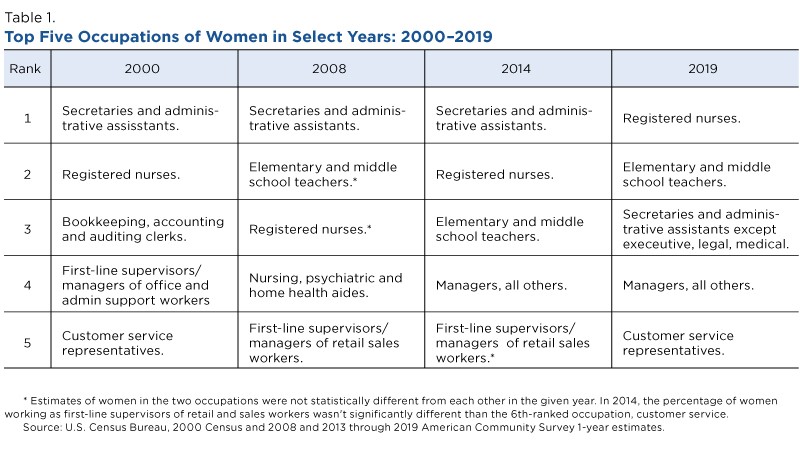
Between 2014 and 2019, secretaries and administrative assistants fell from the largest to the third largest occupation for women, behind registered nurses and elementary and middle school teachers (Table 1).
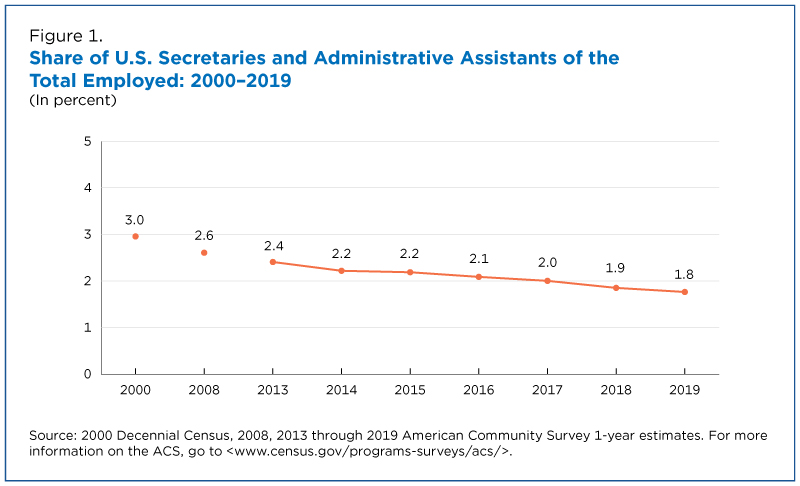
The share of women working full-time, year-round as secretaries has fallen since 2000, from 3.0% (over 2.4 million) in 2000 to 1.8% (2.0 million) in 2019 (Figure 1).
Median earnings of secretaries and administrative assistants remained around $40,000 from 2000 to 2019 (in 2019 inflation-adjusted dollars), between $7,000 and $9,500 less than what the average worker in the United State earned (Figure 2).
While the earnings of secretaries and administrative assistants has been consistently lower than median earnings of all workers, a change in data collection in 2018 highlighted how some types of secretaries and administrative assistants earn more than others in the same occupation.
Different Categories of Secretaries, Administrative Assistants
Beginning in 2018, the Census Bureau expanded the occupation category secretaries and administrative assistants, breaking out three detailed groups — executive, legal and medical — to provide a more nuanced view of these workers than we had before.
For example, in 2019, executive and legal secretaries and administrative assistants earned more than other secretaries and administrative assistants (Figure 2). They also earned more than the average worker in all occupations.
Executive secretaries and administrative assistants earned $60,394 and legal secretaries and administrative assistants earned $51,478 compared with $50,078 for the average U.S. worker in 2019.
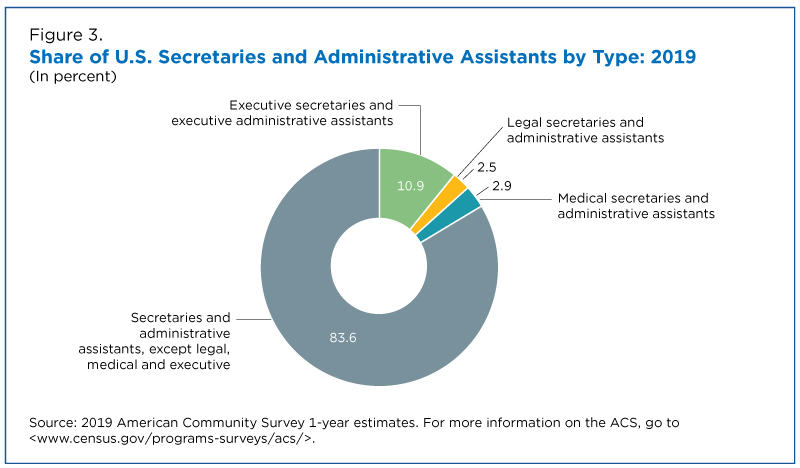
However, these types of secretaries and administrative assistants made up only 13.4% of the total pool of U.S. secretaries and administrative assistants that year (Figure 3).
Most secretaries and administrative assistants consistently earned less than the average worker from 2000 to 2019.
For example, secretaries and administrative assistants (except legal, medical and executive) who make up 83.6% of the total, earned $39,913, significantly lower than the average worker in the United States.
Also, medical secretaries and administrative assistants earned the least, $36,114, but accounted for only 2.9% of all administrative assistants in 2019.
Still Mostly Women
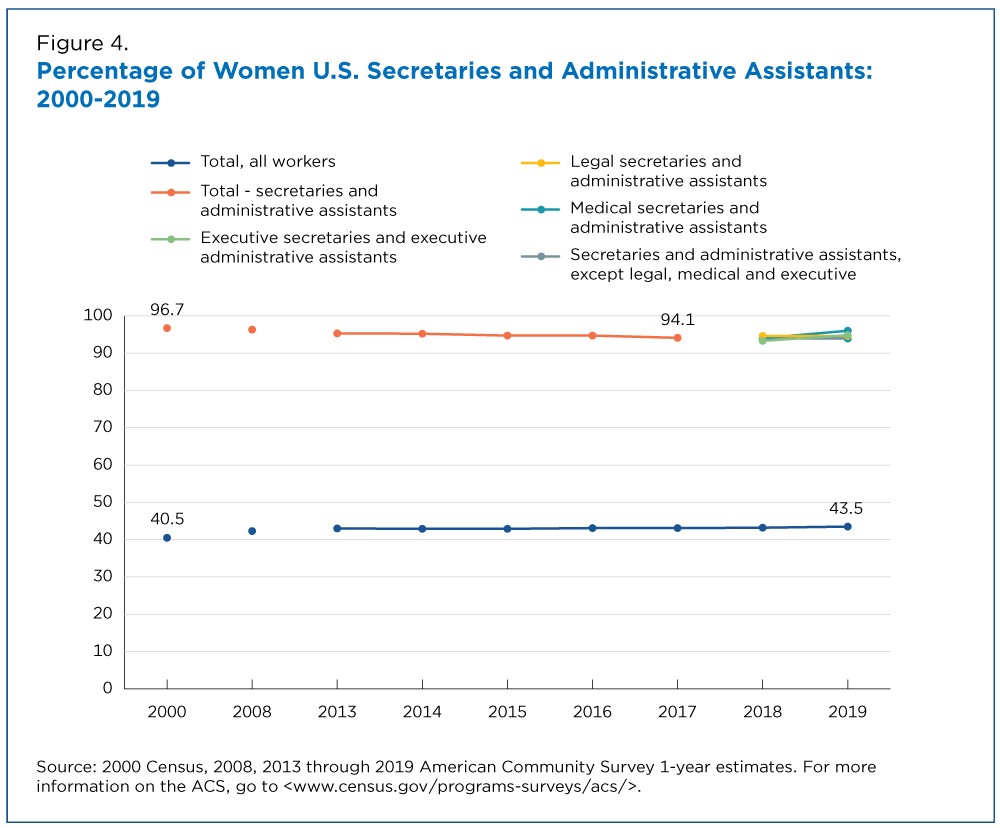
One characteristic that did not change about these positions is that most were held by women — between 93% and 97% of all U.S. secretaries and administrative assistants between 2000 and 2019. For comparison, between 40% and 44% of all workers during the same period were women.
Who Are They?
Not only were secretaries and administrative assistants more likely to be women and have lower median earnings than the average worker in the United States in 2019, they were also older, had less education and were less racially and ethnically diverse than the average U.S. worker.
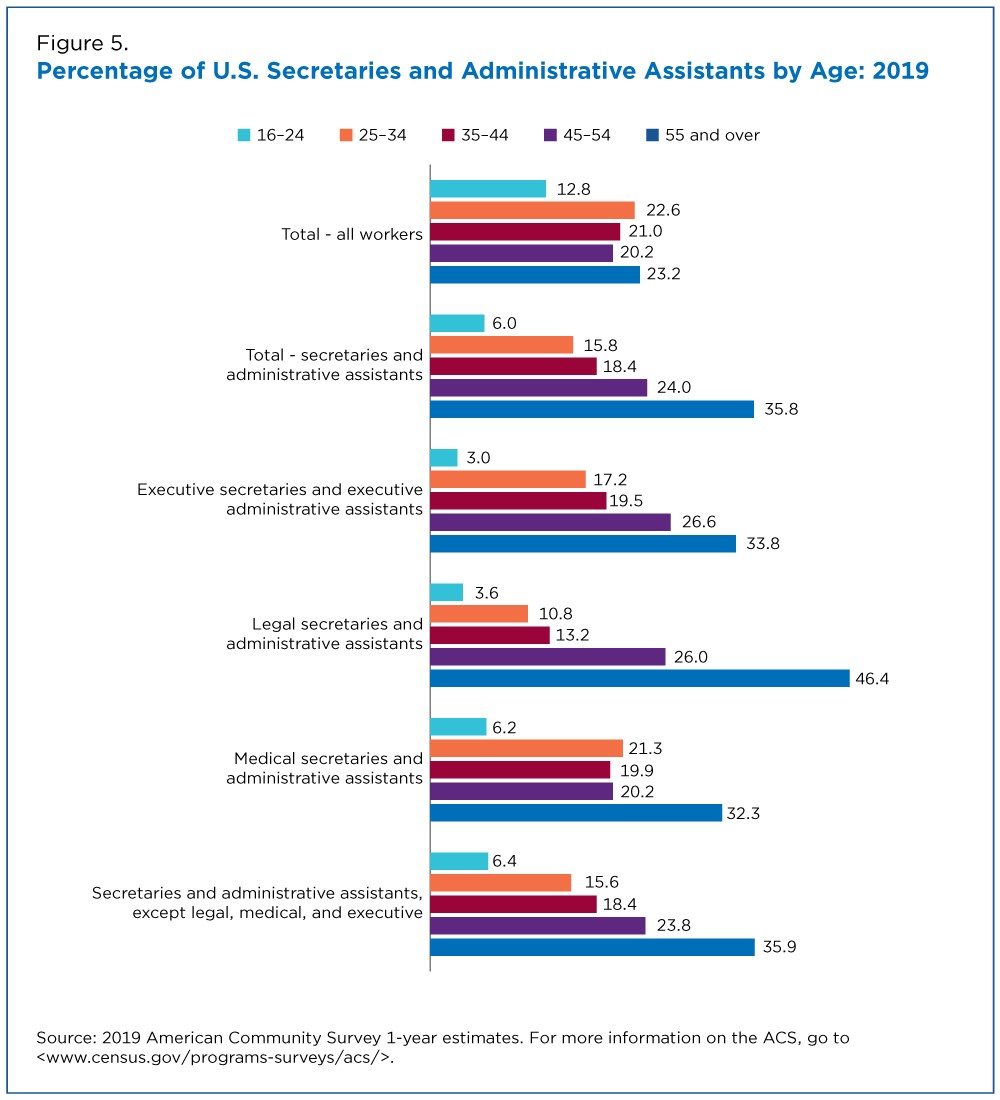
- Age. In 2019, secretaries and administrative assistants were older than the average worker. The share of these workers between the ages of 55 and over was larger than that of the average worker by at least 10 percentage points. This difference was greatest among legal secretaries and administrative assistants — 46% of whom over 55 (Figure 5).
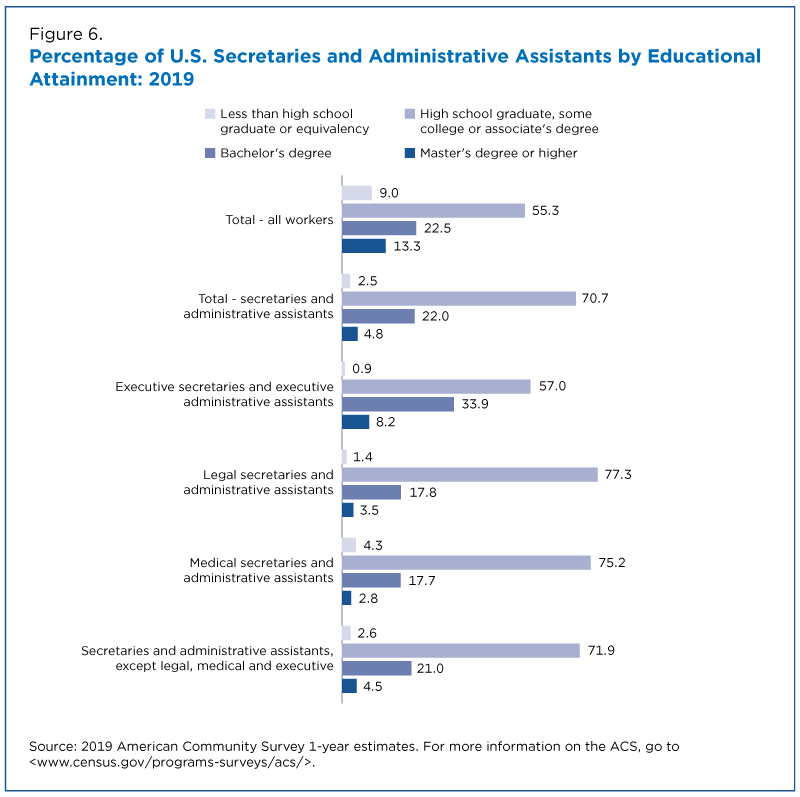
- Education. They were most likely to only be high school graduates: 70.7% were high school graduates compared with 55.3% of all workers. Executive secretaries and executive administrative assistants had the highest share of workers with a bachelor’s degree — 33.9% compared to 22.0% of all secretaries and administrative assistants and 22.5% of all workers (Figure 6).
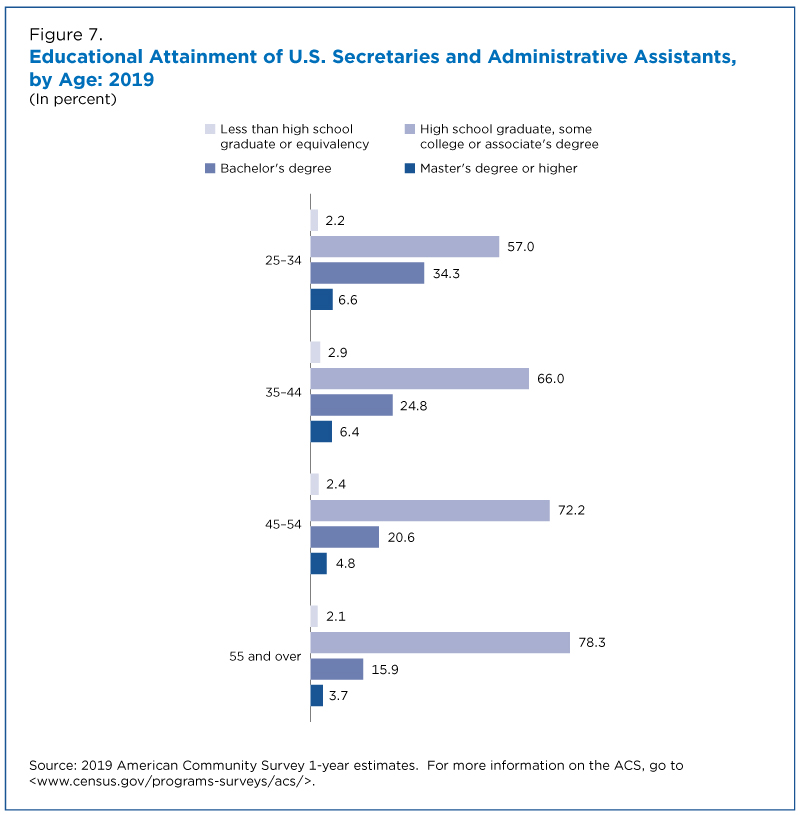
- Age and education. Age played a role in these workers’ education level. For example, 78.3% of secretaries and administrative assistants 55 years and over had no higher than a high school diploma, compared with 57.0% between ages 25 and 34. This younger age group was nearly twice as likely to have a bachelor’s degree and also more likely to have a graduate degree (Figure 7).
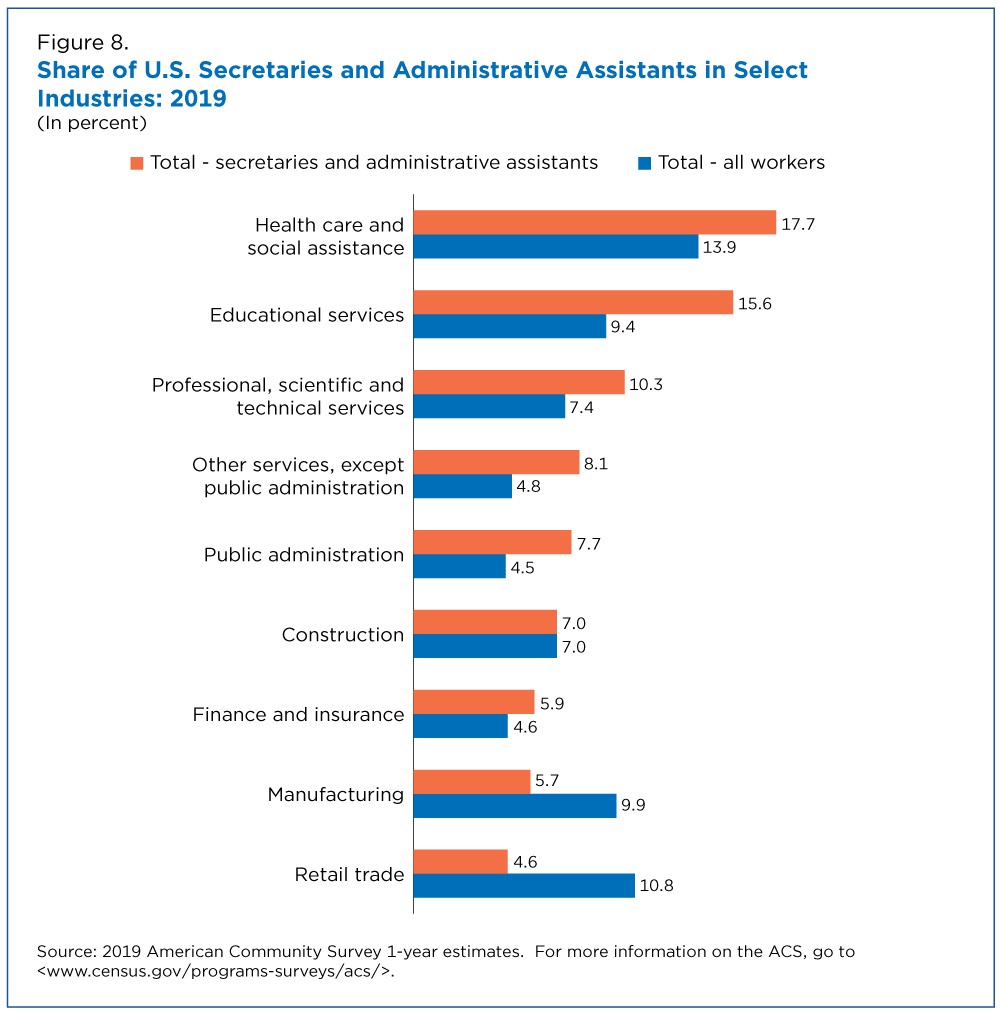
- Industries. U.S. administrative assistants worked in a greater variety of industries than the average worker. Some of the top industries: health care and social assistance; educational services; and professional, scientific and technical services. They were less likely to work in manufacturing and retail trade. Around 11% of all workers compared with 5% of secretaries and administrative assistants had retail trade jobs (Figure 8).
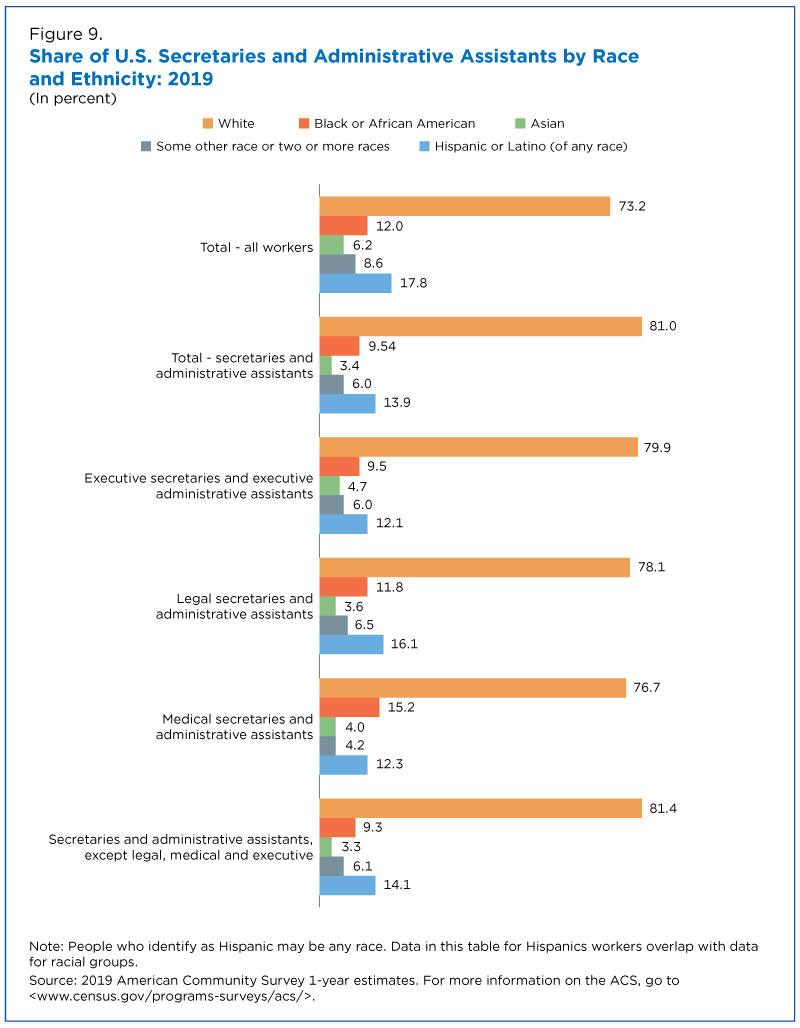
- Race and ethnicity. They were less racially and ethnically diverse than the average worker. About 80% were White compared with 73% of all U.S. workers. The share of Black, Asian, and Hispanic or Latino was less than the share of all U.S. workers with the exception of medical secretaries and administrative assistants, who were more likely to be Black or African American (Figure 9).
For more information about workers by detailed occupation, explore our annual table package for full-time, year-round workers and median earnings. (The Census Bureau also provides detailed materials for comparing occupations over time in the new technical paper, Recent Changes in the Census Industry and Occupation Classification Systems).
Related Statistics
-
Stats for StoriesAdministrative Professionals Week and Day: April 23-29 and 26, 2023The 2021 American Community Survey estimated 1,889,381 secretaries and administrative assistants including 233,339 executive, 46,669 legal, and 67,982 medical.
-
American Community Survey (ACS)The American Community Survey is the premier source for information about America's changing population, housing and workforce.
Subscribe
Our email newsletter is sent out on the day we publish a story. Get an alert directly in your inbox to read, share and blog about our newest stories.
Contact our Public Information Office for media inquiries or interviews.
-
America Counts StoryGender Pay Gap Widens as Women AgeJanuary 27, 2022A U.S. Census Bureau tool, Quarterly Workforce Indicators (QWI) Explorer, illustrates increases in the gender pay gap as women age.
-
America Counts StoryUnequally Essential: Women and Gender Pay Gap During COVID-19March 23, 2021On the eve of Equal Pay Day and as the nation recognizes Women’s History Month, Census Bureau data show women still face pay disparities across occupations.
-
America Counts StoryWhat Is the Gender Wage Gap in Your State?March 01, 2022A new Census Bureau interactive visualization shows the gender wage gap for selected occupations in the states and Puerto Rico.
-
EmploymentThe Stories Behind Census Numbers in 2025December 22, 2025A year-end review of America Counts stories on everything from families and housing to business and income.
-
Families and Living ArrangementsMore First-Time Moms Live With an Unmarried PartnerDecember 16, 2025About a quarter of all first-time mothers were cohabiting at the time of childbirth in the early 2020s. College-educated moms were more likely to be married.
-
Business and EconomyState Governments Parlay Sports Betting Into Tax WindfallDecember 10, 2025Total state-level sports betting tax revenues has increased 382% since the third quarter of 2021, when data collection began.
-
EmploymentU.S. Workforce is Aging, Especially in Some FirmsDecember 02, 2025Firms in sectors like utilities and manufacturing and states like Maine are more likely to have a high share of workers over age 55.

