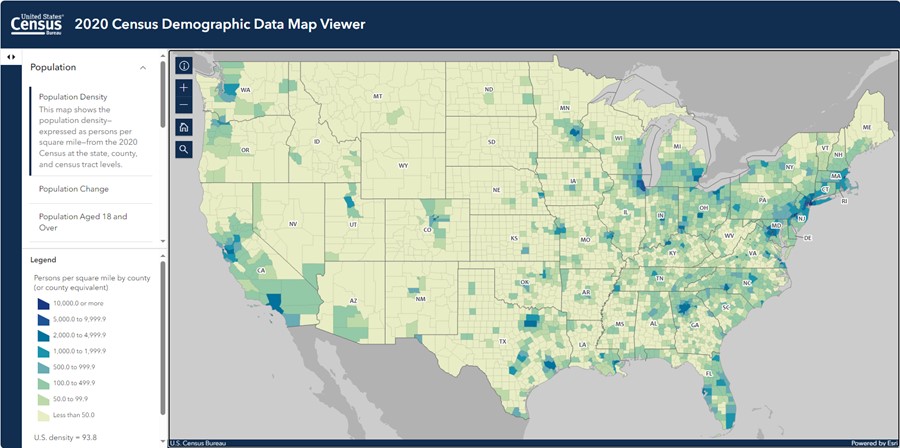
2020 Census Demographic Data Map Viewer
2020 Census Demographic Data Map Viewer
The 2020 Census data underlying this visualization are available in the Redistricting Data Summary Files and the Demographic and Housing Characteristics File. Data tables are available at data.census.gov. Changes since 2010 can be calculated using the 2010 Census data.
The 2020 Census Demographic Data Map Viewer is a web map application that includes data from the 2020 Census at the state, county, and census tract levels. The map includes data related to population, race by Hispanic origin, families and households, housing, and group quarters. The map automatically switches from state data to county data and tract data as you zoom in to more detailed scales. The following maps are available within the application:
Population1
- Population Density
- Change in Population (from 2010 to 2020)
- Population Aged 18 and Over
- Population Aged 65 and Over
Race alone2, not Hispanic or Latino3
- White
- Black or African American
- American Indian and Alaska Native
- Asian
- Native Hawaiian and Other Pacific Islander
- Some Other Race
- Two or More Races
Race alone2, Hispanic or Latino3
- White
- Black or African American
- American Indian and Alaska Native
- Asian
- Native Hawaiian and Other Pacific Islander
- Some Other Race
- Two or More Races
Race alone or in combination4, not Hispanic or Latino3
- White
- Black or African American
- American Indian and Alaska Native
- Asian
- Native Hawaiian and Other Pacific Islander
- Some Other Race
Race alone or in combination4, Hispanic or Latino3
- White
- Black or African American
- American Indian and Alaska Native
- Asian
- Native Hawaiian and Other Pacific Islander
- Some Other Race
Families and Households
- Married-Couple Households
- Unmarried-Couple Households
- One-Person Households
- Multigenerational Households
Housing
- Occupied Housing Units
- Owner-Occupied Housing Units
Group Quarters
- Group Quarters Population
- Institutional Group Quarters Population
- Noninstitutional Group Quarters Population
To help you get started, please refer to the resources below.
Interact with the live application by opening it in a separate window.
To learn more about the data, please refer to the resources below.
Table
1 The change in population map includes data at the state and county levels only. The 2010 populations were calculated for the following 2020 county or equivalent areas based on the changes described in the Substantial Changes to Counties and County Equivalent Entities: Chugach Census Area, AK; Copper River Census Area, AK; Hoonah-Angoon Census Area, AK; Kusilvak Census Area, AK; Petersburg Borough, AK; Prince of Wales-Hyder Census Area, AK; and Bedford County, VA.
2 People who respond to the question on race by indicating only one race category are referred to as the race alone population, or the group who reported only one race. For example, respondents who report a single detailed Asian group, such as “Asian Indian” or “Korean,” would be included in the Asian alone population. Respondents who report more than one detailed Asian group, such as “Asian Indian” and “Korean” would also be included in the Asian alone population. This is because the detailed groups in the example combination are part of the larger Asian race category. The Asian alone population can be viewed as the minimum number of people reporting Asian.
3 Ethnicity is defined by the Office of Management and Budget (OMB) as either “Hispanic or Latino” or “Not Hispanic or Latino.” The OMB defines "Hispanic or Latino" as a person of Cuban, Mexican, Puerto Rican, South or Central American, or other Spanish culture or origin regardless of race. People who identify as Hispanic, Latino, or Spanish may be of any race.
4 The maximum number of people reporting a particular race is reflected in the race alone or in combination concept. This represents the number of times responses were part of one of the six major race categories, either alone or in combination with the other five race categories. For example, a respondent who identified as "Asian" and "White" was counted in the Asian race alone or in combination category as well as in the White race alone or in combination category. Therefore, the sum of all race alone or in combination categories equals the number of races reported (i.e., responses), which exceeds the total population.
Note: The search by address functionality in the Search box uses the ArcGIS World Geocoding Service to locate addresses, not the Census Bureau's Master Address File (which is protected from disclosure by Title 13 of the U.S. Code).


