
end of header
Newsroom Archive
Release Information
Contact: Public Information Office
301-763-3030
FOR IMMEDIATE RELEASE: TUESDAY, MAY 22, 2012
Census Bureau Releases Estimates of Undercount and Overcount in the 2010 Census
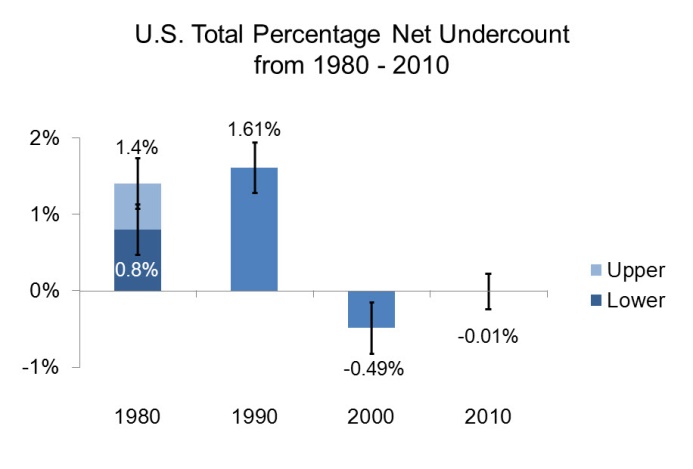
The U.S. Census Bureau released today results from its post-enumeration survey, providing a measure of the accuracy of the 2010 Census. The results found that the 2010 Census had a net overcount of 0.01 percent, meaning about 36,000 people were overcounted in the census. This sample-based result, however, was not statistically different from zero.
The post-enumeration survey, called “Census Coverage Measurement,” measures the coverage of the nation's household population (excluding the 8.0 million people in “group quarters,” such as nursing homes or college dorms). It surveys a sample of the 300.7 million people living in housing units and then matches the responses to the census, resulting in estimates of error.
The 2000 Census had an estimated net overcount of 0.49 percent and the 1990 Census had a net undercount of 1.61 percent.
“On this one evaluation — the net undercount of the total population — this was an outstanding census,” Census Bureau Director Robert Groves said. “When this fact is added to prior positive evaluations, the American public can be proud of the 2010 Census their participation made possible.”
Components of Coverage
The Census Bureau also released estimates of the components of coverage: the number of correct census records, erroneous enumerations and omissions.
The Census Bureau estimates that among the 300.7 million people who live in housing units, about 94.7 percent were counted correctly, about 3.3 percent were counted erroneously, 1.6 percent provided only a census count and had their demographic characteristics imputed, or statistically inserted, and 0.4 percent needed more extensive imputation after all census follow-up efforts were attempted. Among those erroneously counted, about 84.9 percent were duplicates, while the remainder were incorrectly counted for another reason, such as people who died before Census Day (April 1, 2010), who were born after Census Day or were fictitious census records.
The Census Bureau estimated 16.0 million omissions in the census. Omissions include people missed in the census and people whose census records could not be verified in the post-enumeration survey because they did not answer enough of the demographic characteristic questions in the census. Of the 16.0 million omissions, about 6.0 million were likely counted in the census but couldn't be verified in the post-enumeration survey.
Variation by Characteristics
As with previous censuses, the coverage of the population varied across demographic characteristics.
The 2010 Census undercounted renters by 1.1 percent, showing no significant change compared with 2000. Homeowners were overcounted in both the 2000 and 2010 censuses. However, the 2010 Census reduced the net overcount for homeowners from 1.2 percent to 0.6 percent. Renters were more likely to be duplicated than owners and twice as likely to have all of their characteristics imputed.
As with prior censuses, coverage varied by race and Hispanic origin. The 2010 Census overcounted the non-Hispanic white alone population by 0.8 percent, not statistically different from an overcount of 1.1 percent in 2000.
The 2010 Census undercounted 2.1 percent of the black population, which was not statistically different from a 1.8 percent undercount in 2000. In 2010, 1.5 percent of the Hispanic population was undercounted. In 2000, the estimated undercount of 0.7 percent was not statistically different from zero. The difference between the two censuses was also not statistically significant.
The Census Bureau did not measure a statistically significant undercount for the Asian or for the Native Hawaiian and Other Pacific Islander populations in 2010 (at 0.1 percent and 1.3 percent, respectively). These estimates were also not statistically different from the results measured in 2000 (a 0.8 percent overcount and a 2.1 percent undercount, respectively).
Coverage of the American Indian and Alaska Native population varied by geography. American Indians and Alaska Natives living on reservations were undercounted by 4.9 percent, compared with a 0.9 percent overcount in 2000. The net error for American Indians not living on reservations was not statistically different from zero in 2010 or 2000.
Men 18 to 29 and 30 to 49 were undercounted in 2010, while women 30 to 49 were overcounted, a pattern consistent with 2000. The estimated overcount of women 18 to 29 was not statistically significant.
“While the overall coverage of the census was exemplary, the traditional hard-to-count groups, like renters, were counted less well,” Groves said. “Because ethnic and racial minorities disproportionately live in hard-to-count circumstances, they too were undercounted relative to the majority population.”
Other Findings
- The post-enumeration survey did not measure a statistically significant undercount or overcount in the population or housing units for any state.
- The survey did not measure a statistically significant undercount or overcount for the population in any counties or places of 100,000 or more.
- The 2010 Census undercounted housing units, mostly because of an undercount of vacant units. On the other hand, there was no statistically significant undercount or overcount of occupied housing units.
- As a whole, erroneous enumerations and imputations were lower among people who mailed back a census form, compared with those counted by a door-to-door census taker. Additionally, responses mailed back earlier in the process were generally less likely to have erroneous enumerations than those mailed later.
- Among people counted door-to-door by a census taker, responses from a household member were more accurate than those from proxies, such as neighbors or landlords who provided information when a householder could not be reached or refused to participate in the census.
“We'll use these coverage estimates to build a better 2020 Census,” Groves said. “The 2010 Census used a variety of operations to improve coverage of the population. We now have measures of their success, which will inform cost-quality tradeoff decisions for the 2020 Census.”
The post-enumeration survey is one of three types of indicators that measure the quality of a census. The others consist of process indicators, which measure the quality of census operations and data collection, and comparisons to other methods of estimating population size. Each type of quality indicator has its own strengths and weaknesses as a measurement tool. For example, the estimates from the post-enumeration survey have sampling error and are susceptible to violations of the underlying statistical assumptions.
 Yes
Yes
 No
No
Comments or suggestions?