November 2022:
By the Numbers
Join us this month as we celebrate American Indian and Alaska Native Heritage Month and Geography Awareness Week.
Explore statistics about six states and learn more about Thanksgiving.


🎧 Listen to By the Numbers
Play this YouTube video to listen to our featured observances, anniversaries, and historical events for the month ahead.
Help Us Spread the Word!
Visit our By the Numbers page to download audio files and scripts. We encourage media, partners, and stakeholders to share this content with your audiences on radio, podcasts, and social media channels.
🌎 American Indian and Alaska Native Heritage Month


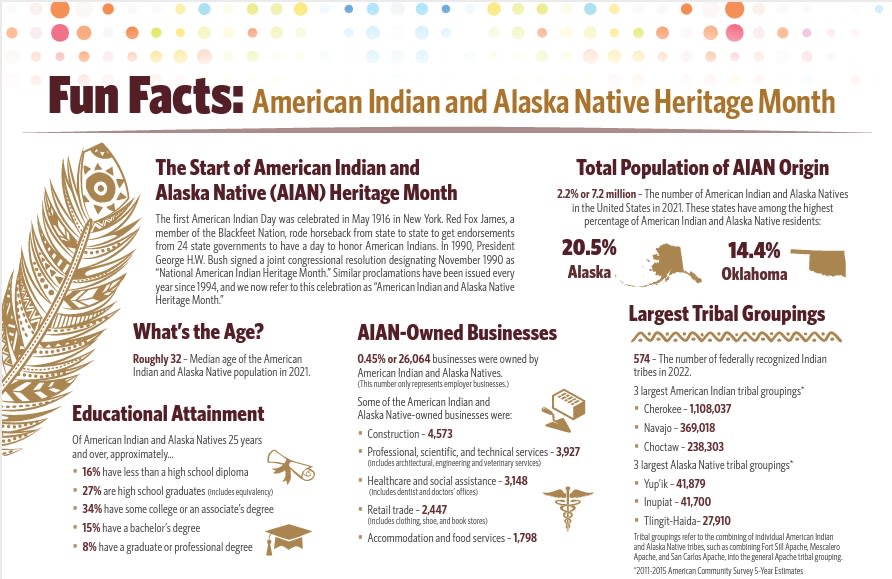
The first American Indian Day was celebrated in May 1916, in New York. In 1990, more than seven decades later, then-President George H.W. Bush signed a joint congressional resolution designating the month of November “National American Indian Heritage Month.”


Similar proclamations have been issued every year since 1994 to recognize what is now called “American Indian and Alaska Native Heritage Month.”
🔎 Did you know? American Indian and Alaska Native is one of the six major race categories defined by the U.S. Office of Management and Budget.
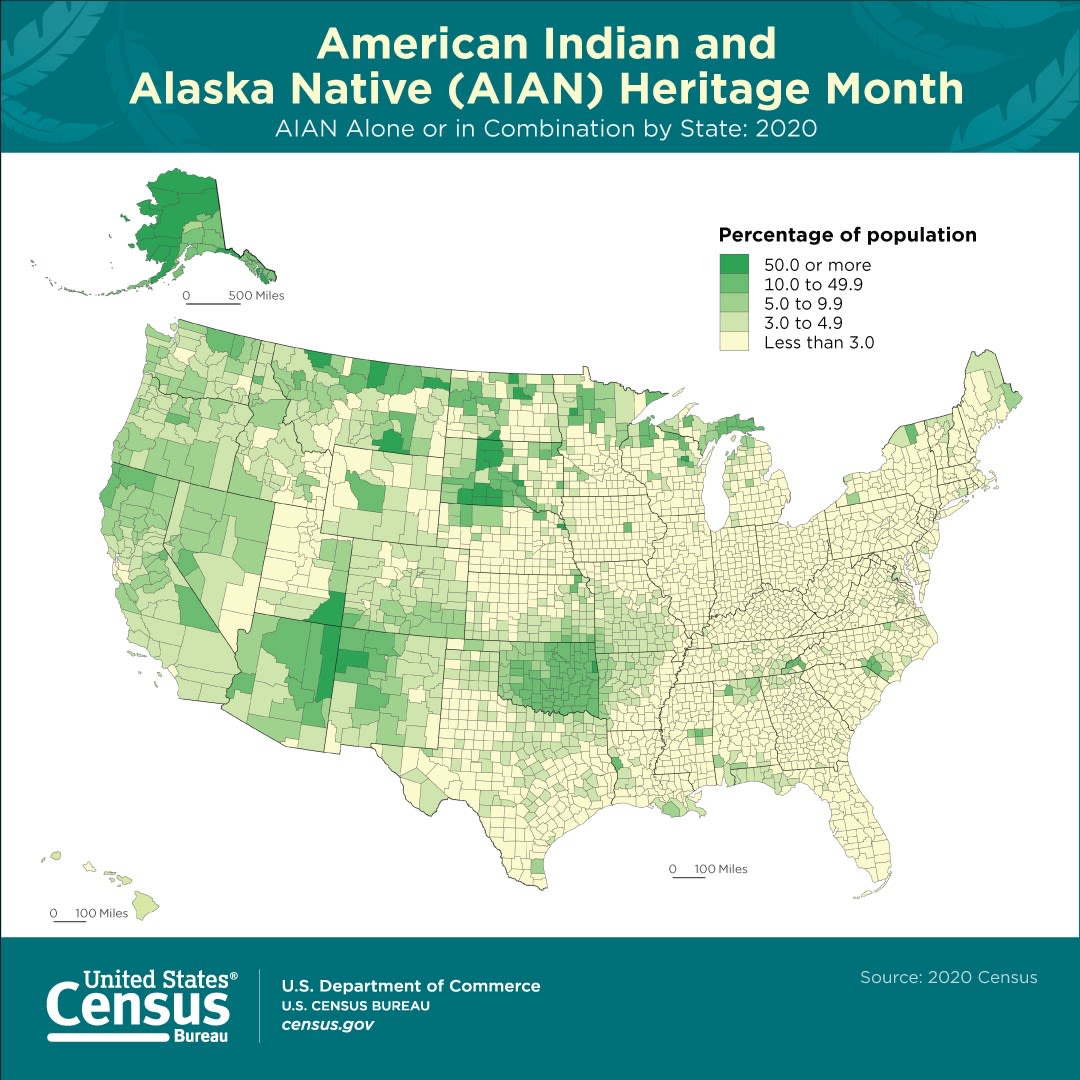
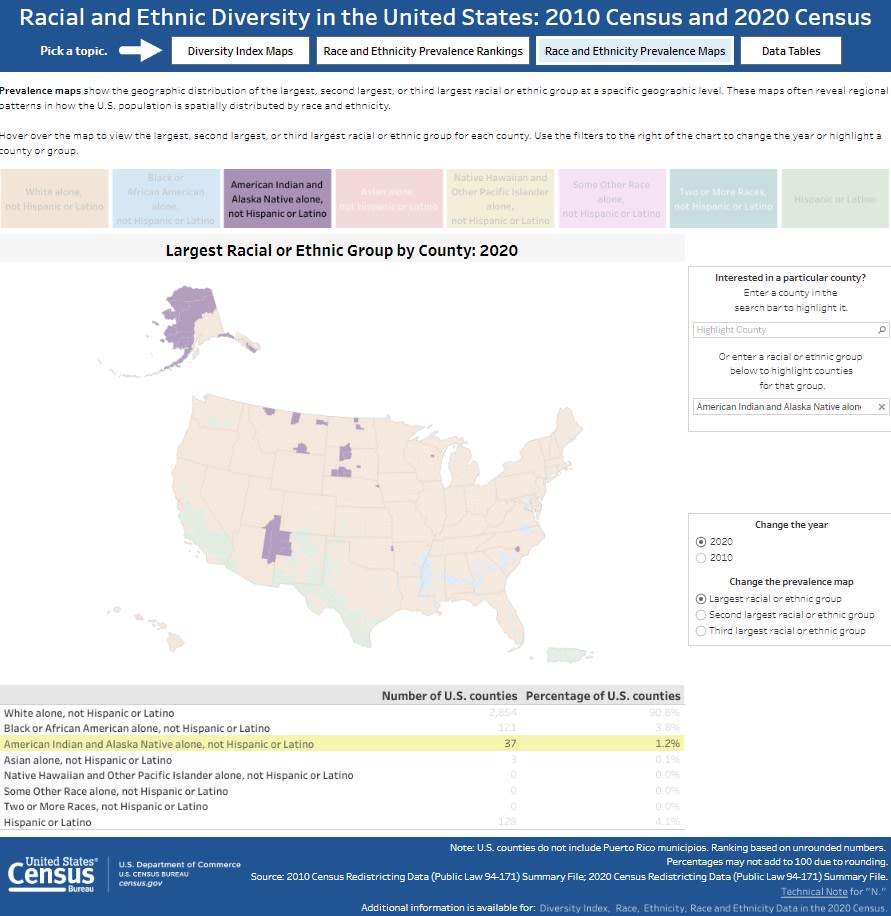
✅ The nation’s American Indian and Alaska Native population alone in 2020 was 3.7 million. This population group identifies as AIAN only and did not identify with any other race.
📍 The map below shows the nation's American Indian and Alaska Native population alone or in combination by state in 2020.

Visit our Stats for Stories page to learn more about Native American Heritage Day and other upcoming observances.
Infographics & Data Visualizations


You May Be Interested In

- Statistics in Schools Fun Facts: American Indian and Alaska Native Heritage Month
- Test Your Trivia Knowledge: Fun Facts About American Indian and Alaska Native Heritage Month
- Facts for Features: American Indian and Alaska Native Heritage Month
- Stats for Stories: Native American Heritage Day


- Census Academy Webinar: Your Tribal Nation by the Numbers: Accessing American Indian and Alaska Native Statistics
- Data Tables: Detailed profile on data.census.gov
- Data Tool: My Tribal Area
- Data Equity: Advancing Equity With Data
- Data Summit Webinar: Census Bureau Data for the AIAN Population and Businesses


4️⃣ Facts for American Indian and Alaska Native Heritage Month


1. The total population of American Indian and Alaska Native (AIAN) origin was 7.2 million in 2021.
2. Alaska (20.5%) had the highest percentage of AIAN residents in 2021, followed by Oklahoma (14.4%).
3. There were 546 federally recognized Indian tribes in 2022.
4. The American Indian and Alaska Native population alone or in combination with other race groups is projected to be 10.1 million on July 1, 2060.
These facts are available thanks to the public’s participation in Census Bureau surveys. We appreciate the information shared by each respondent as we continuously count and measure America’s people, places, and economy.
🧭 Geography Awareness Week

Geography Awareness Week takes place this year from November 14th to the 18th. And on November 16th, we celebrate GIS Day to help others learn about geographic information systems.
Geography is central to the work of the U.S. Census Bureau, providing the framework for survey design, sample selection, data collection, tabulation, and dissemination. Geography provides meaning and context to statistical data.
You can celebrate Geography Awareness Week by:
- Exploring geographic profiles on data.census.gov
- Using lessons, games, and challenges in the classroom
- And learning about the 2020 Census Center of Population
Geography Videos and Resources
Take a look at how the U.S. Census Bureau uses aerial and satellite imagery to discover and confirm the location of addresses, roads, and boundaries, ensuring geospatial accuracy in census survey taking and results.
The U.S. is made up of many geographic types - such as census blocks, block groups, and tracts - which offer an understanding of different demographic, social, and economic pictures of the nation.
The Census Bureau’s urban-rural classification provides an important baseline set of urban and rural areas for data presentation and analysis.
- Video: The Work of Census Bureau Geographers: In Their Own Voices
- Census.gov: Geography Program
- Data Tools: Interactive Maps
- Census Academy: Geography Resources
- Census Academy Webinar: To Nest, or Not to Nest, That is the Quest
- Statistics in Schools: State Facts for Students
Gina the Geographer
Gina the Geographer has escaped to a secret location. It’s your mission to find her and bring her back to school! Put your geography skills to the test and use these census data-powered clues about landmarks, weather, population, and more to figure out where Gina’s hiding.

Play an interactive game on your computer, tablet, or mobile phone! Put your geography skills to the test to find Gina the Geographer.

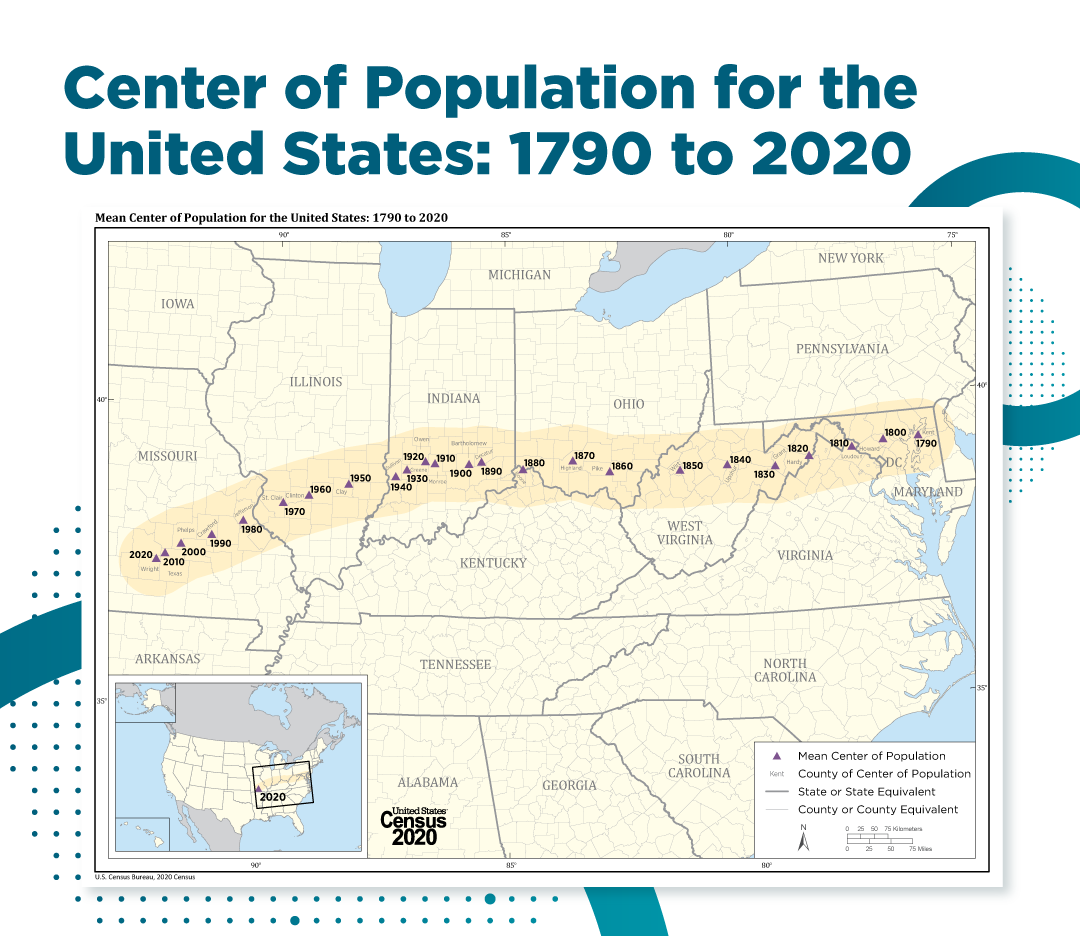
What is the Center of Population?
If the United States map was a scale and every person had equal weight, the center of population is the place where the scale would balance. In other words, the center of population is the average location of where people in the United States currently live.
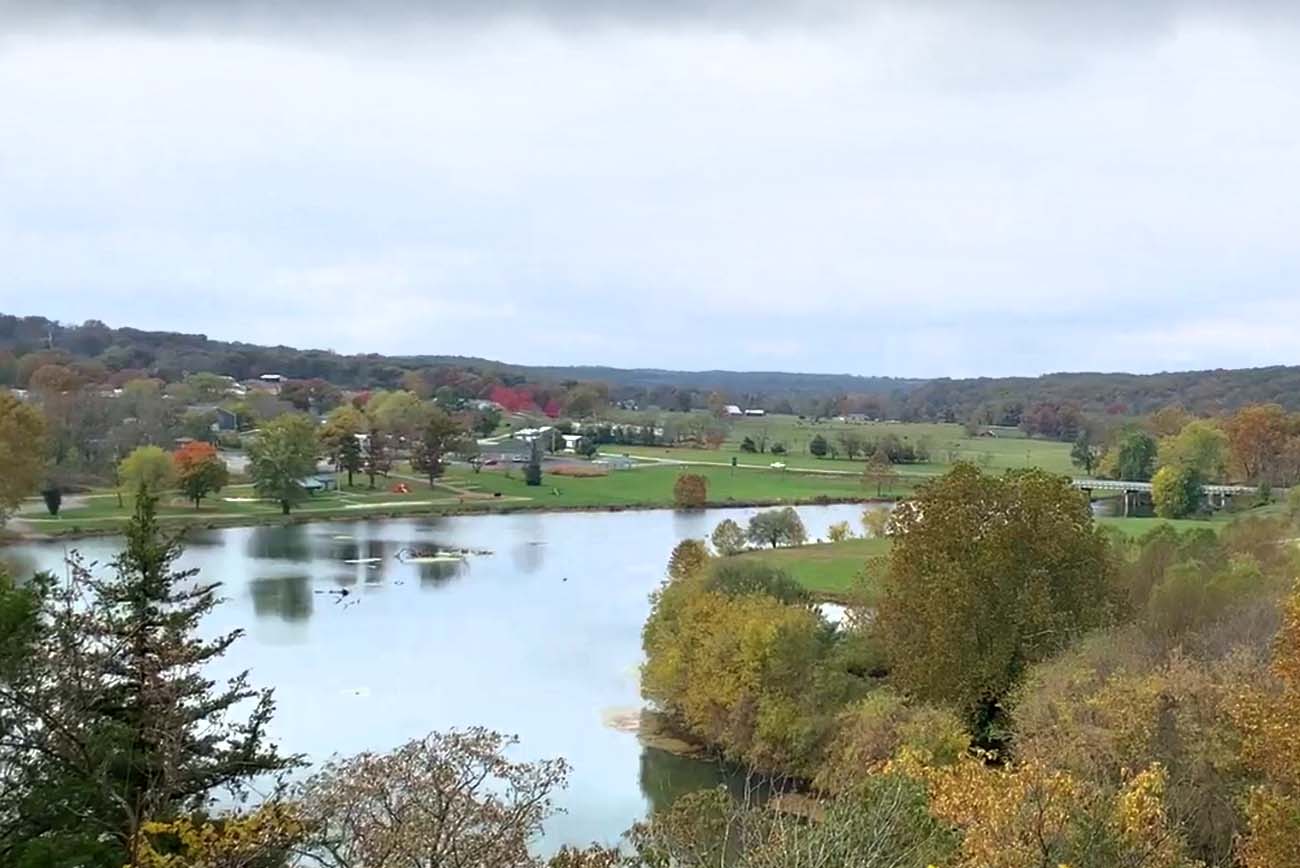
📍 Based on data from the 2020 Census, the current center of the population is near Hartville, Missouri.
📜 The first center of population based on the 1790 Census was located in Chestertown, Maryland.
You May Be Interested In
- Video: What is the Center of Population and How Has it Changed Since 1790?
- Interactive Story Map: Centers of Population
- Data Visualization: 2020 Census Center of Population Data Visualization
- America Counts Story: The “Hart” of the Nation’s Population: Hartville, Missouri (Pop. 594)
- Census.gov: Centers of Population
- Data: Centers of Population Time Series
- Data: National Centers of Population for the 1790 - 2020 Censuses
- Data: Historical State Centers of Population by State for 1880-2020 Censuses


🎂 Happy Birthday to North Dakota, South Dakota, Montana, Washington, Oklahoma, and North Carolina!
November 2nd, 2022:
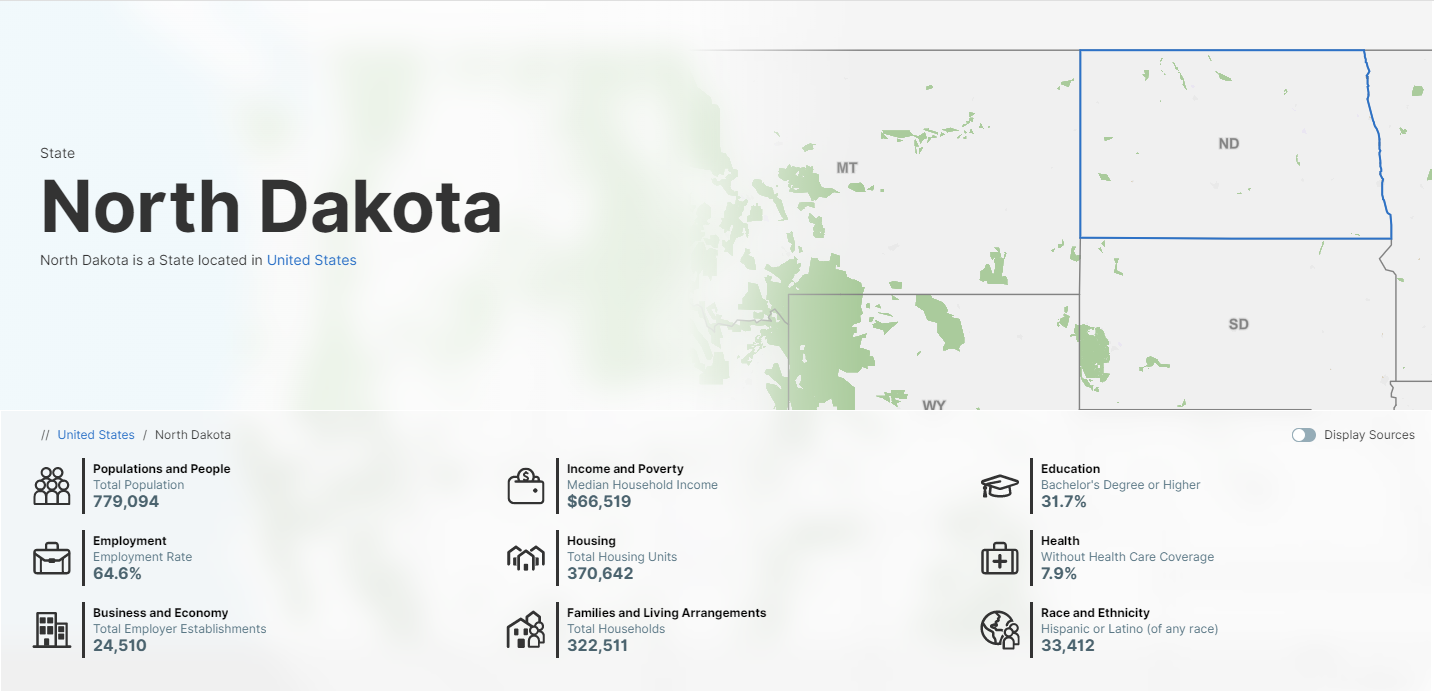
North Dakota's 133rd Anniversary
🔎 Did you know? North Dakota is the 17th largest state by area and was the 39th state to join the Union.
🌹 The state flower is the Wild Prairie Rose.
🌱 The state nickname is the Peace Garden State.
🌆 The largest city is Fargo.

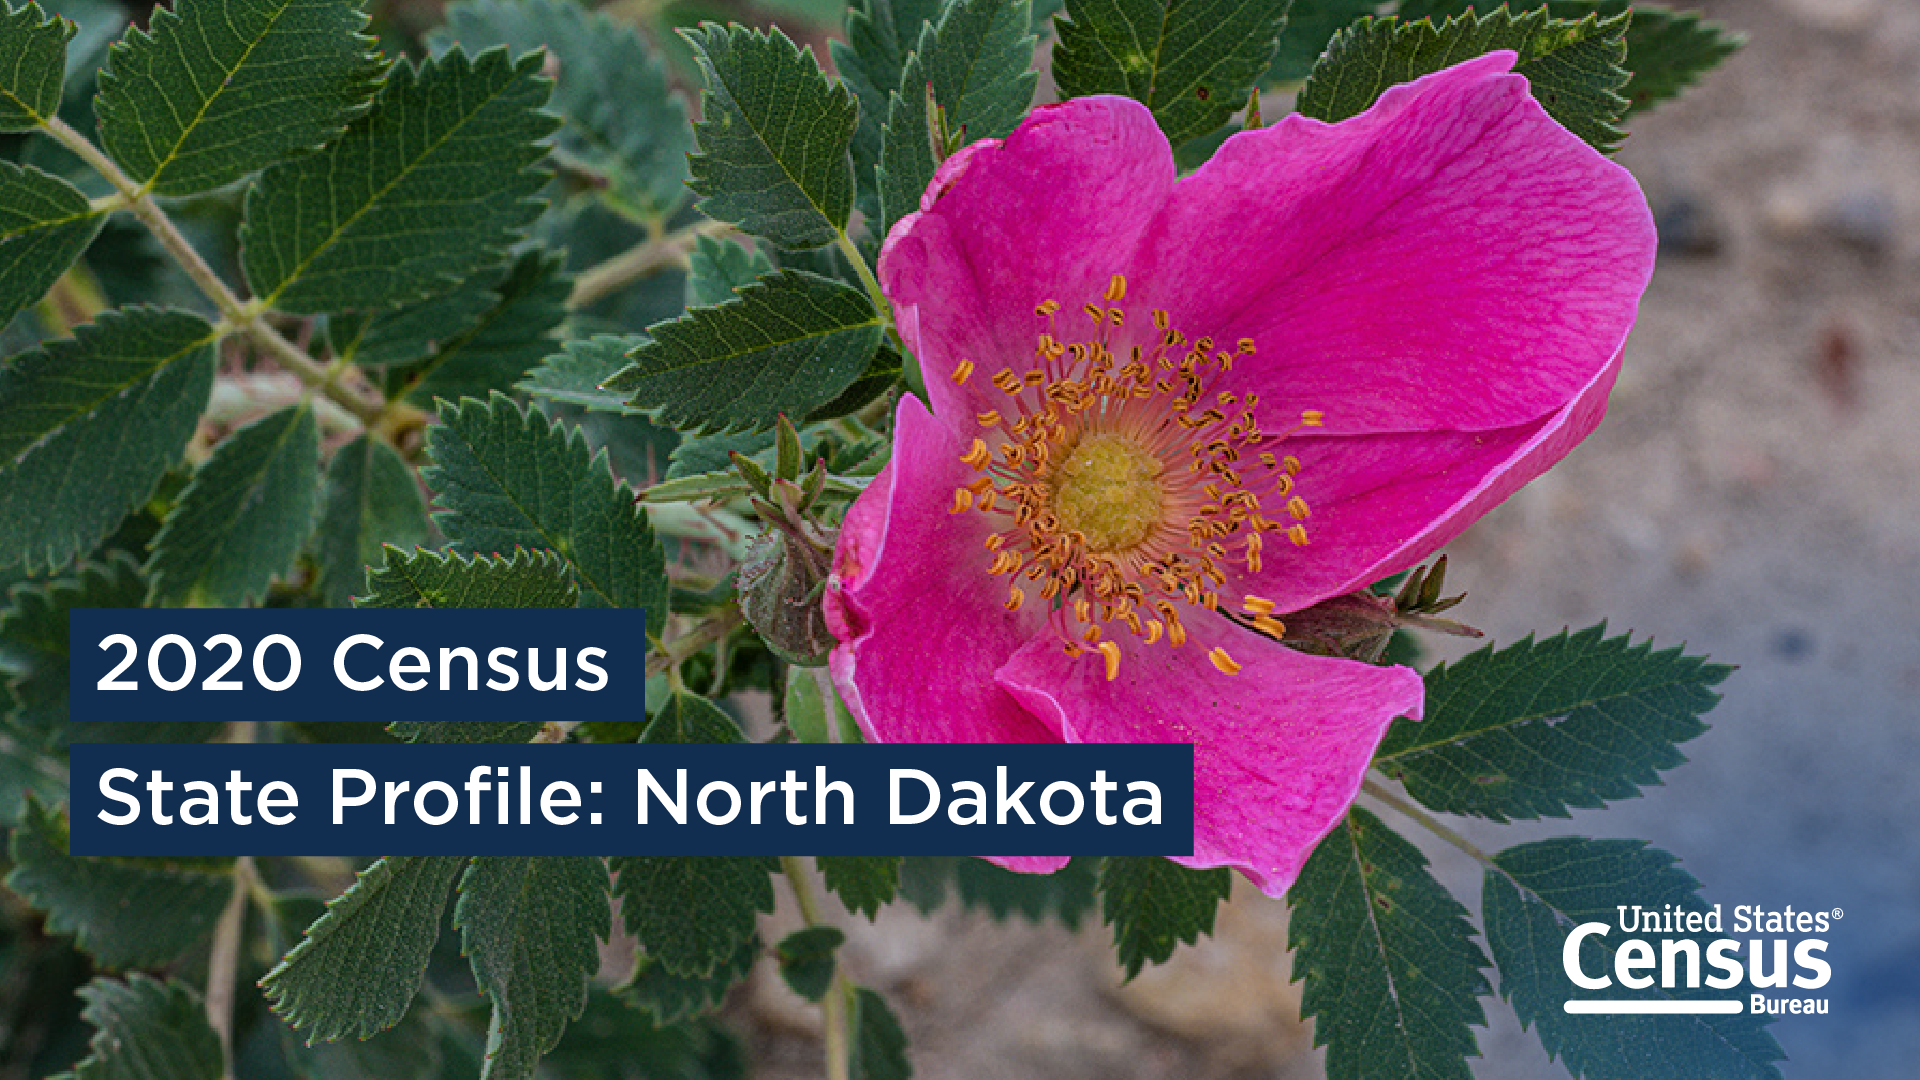
North Dakota was the fourth fastest growing state from 2010 to 2020.
The results of the 2020 Census show that:
- The total population of North Dakota was 779,094 – an increase of 15.8% from 2010
- 33,412 or 4.3% of people in North Dakota reported Hispanic or Latino origin – an increase of 148.1% from 2010
🌐 Check out our America Counts state profile for North Dakota

🌐 Explore Census Bureau data for North Dakota using data.census.gov
November 2nd, 2022:
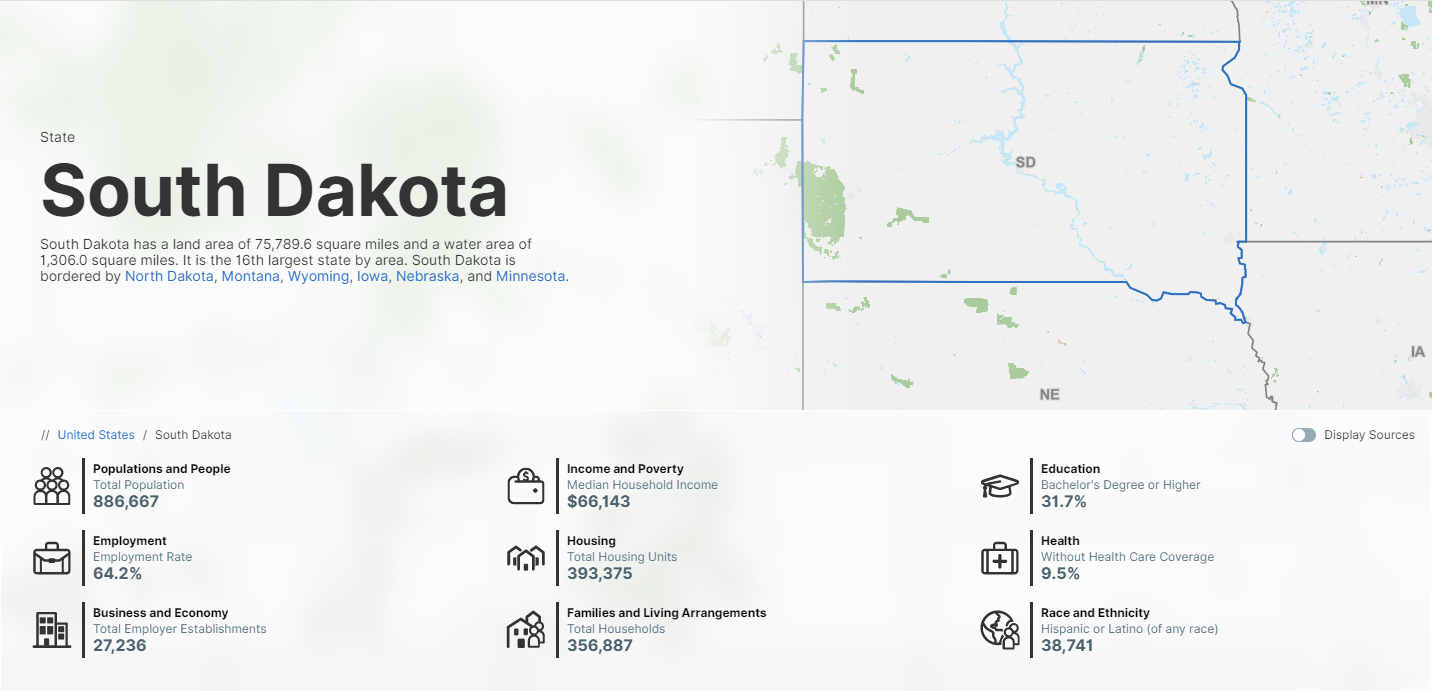
South Dakota's 133rd Anniversary
🔎 Did you know? South Dakota is the 16th largest state by area and was the 40th state to join the Union.
🐦 The state bird is the Ring-Necked Pheasant.
🌄 The state nickname is the Mount Rushmore State.
🌃 The largest city is Sioux Falls.
South Dakota grew by 8.9% from 2010 to 2020.
The results of the 2020 Census show that:
- The total population of South Dakota was 886,667 – an increase of 8.9% from 2010
- 38,741 or 4.4% of people in South Dakota reported Hispanic or Latino origin – an increase of 75.1% from 2010
🌐 Check out our America Counts state profile for South Dakota

🌐 Explore Census Bureau data for South Dakota using data.census.gov
November 8th, 2022:
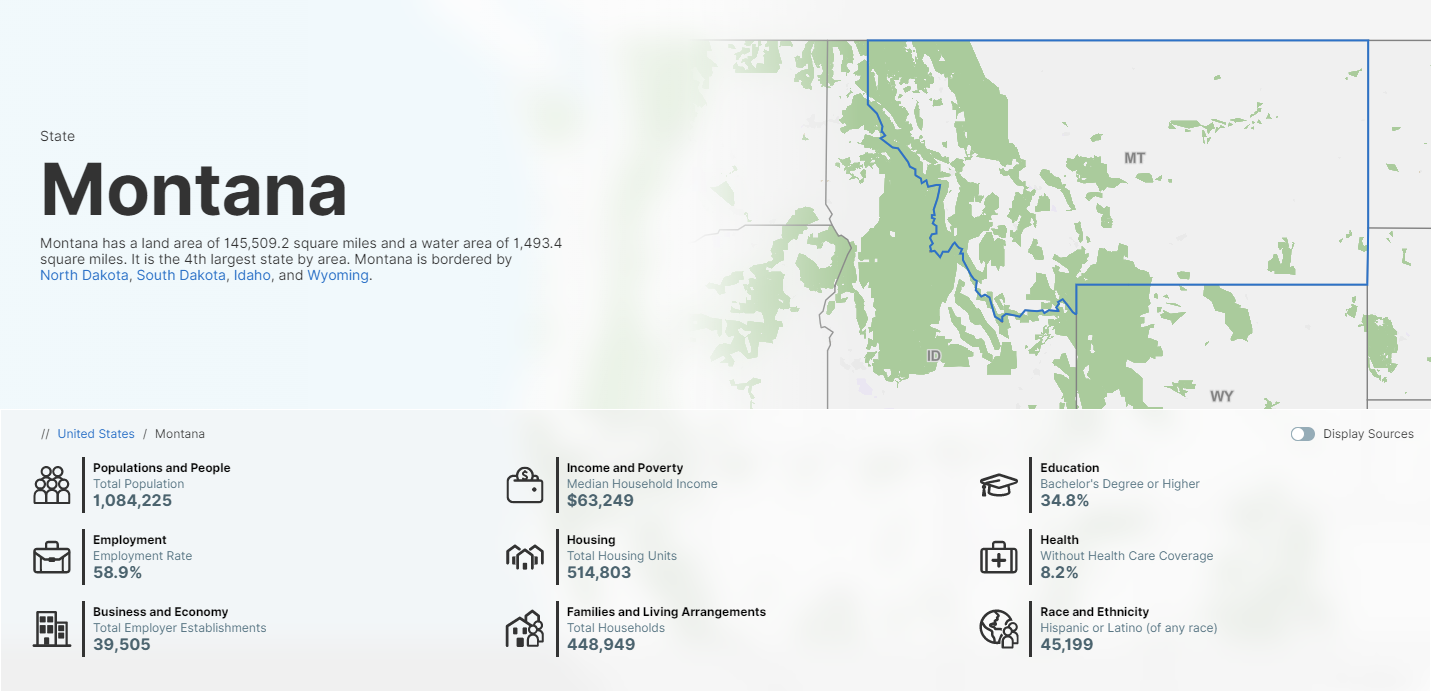
Montana's 133rd Anniversary
🔎 Did you know? Montana is the 4th largest state by area and was the 41st state to join the Union.
🌲 The state tree is the Ponderosa Pine.
💰 The state nickname is the Treasure State.
🌇 The largest city is Billings.
Montana's population topped the 1 million mark in 2020.
The results of the 2020 Census show that:
- The total population of Montana was 1,084,225 – an increase of 9.6% from 2010
- 45,199 or 4.2% of people in Montana reported Hispanic or Latino origin – an increase of 58.2% from 2010
🌐 Check out our America Counts state profile for Montana
🌐 Explore Census Bureau data for Montana using data.census.gov
November 11th, 2022:
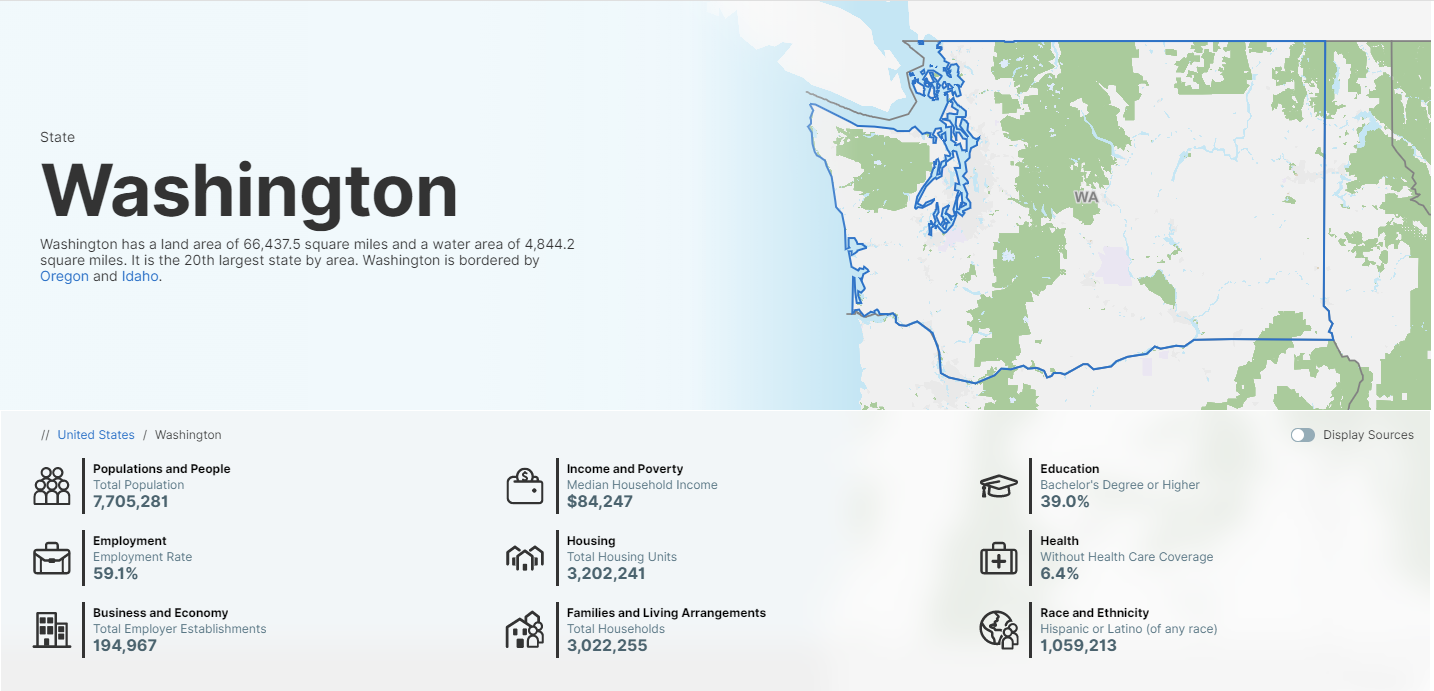
Washington's 133rd Anniversary
🔎 Did you know? Washington is the 20th largest state by area and was the 42nd state to join the Union.
🌸 The state flower is the Coast Rhododendron.
🌲 The state nickname is the Evergreen State.
🌃 The largest city is Seattle.
Washington's population grew by almost 1 million since 2010.
The results of the 2020 Census show that:
- The total population of Washington was 7,705,281 – an increase of 14.6% from 2010
- 1,059,213 or 13.7% of people in Washington reported Hispanic or Latino origin – an increase of 40.1% from 2010
🌐 Check out our America Counts state profile for Washington
🌐 Explore Census Bureau data for Washington using data.census.gov
November 16th, 2022:
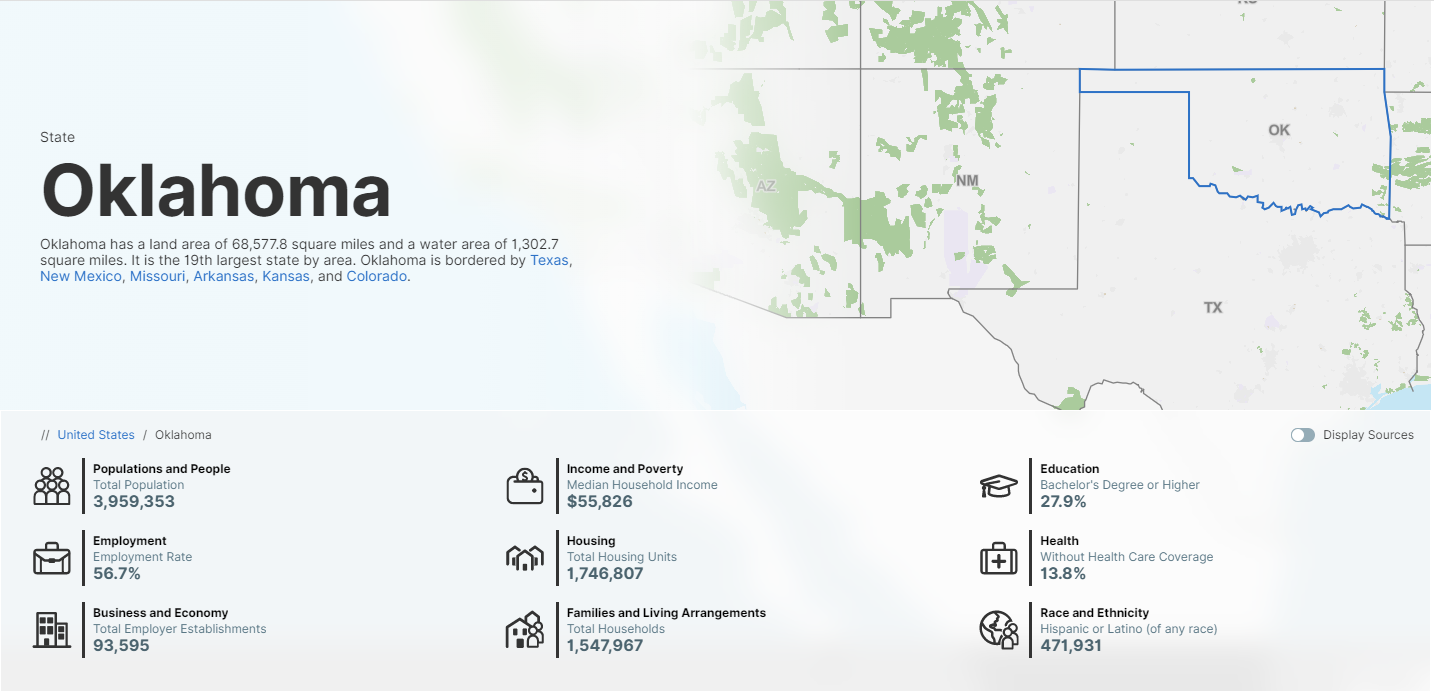
Oklahoma's 115th Anniversary
🔎 Did you know? Oklahoma is the 19th largest state by area and was the 46th state to join the Union.
🌳 The state tree is the Redbud.
🐎 The state nickname is the Sooner State.
🏛 The largest city is Oklahoma City.
Oklahoma's population grew by 5.5% since 2010.
The results of the 2020 Census show that:
- The total population of Oklahoma was 3,959,353 – an increase of 5.5% from 2010
- 471,931 or 11.9% of people in Oklahoma reported Hispanic or Latino origin – an increase of 42.1% from 2010
🌐 Check out our America Counts state profile for Oklahoma
🌐 Explore Census Bureau data for Oklahoma using data.census.gov
November 21st, 2022:
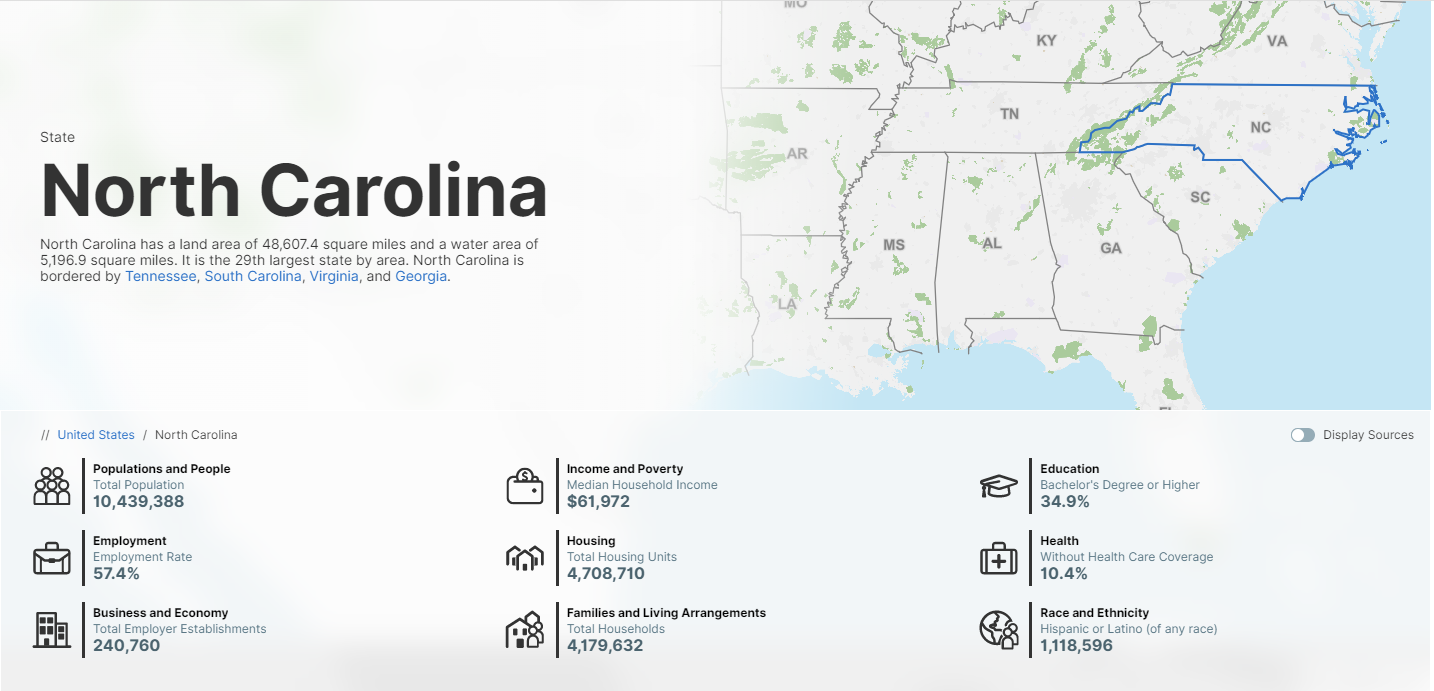
North Carolina's 233rd Anniversary
🔎 Did you know? North Carolina is the 29th largest state by area and was the 12th state to join the Union.
🌲 The state tree is the Pine.
👣 The state nickname is the Tar Heel State.
🌇 The largest city is Charlotte.
North Carolina gained around 900,000 people since 2010.
The results of the 2020 Census show that:
- The total population of North Carolina was 10,439,388 – an increase of 9.5% from 2010
- 1,118,596 or 10.7% of people in North Carolina reported Hispanic or Latino origin – an increase of 39.8% from 2010
🌐 Check out our America Counts state profile for North Carolina
🌐 Explore Census Bureau data for North Carolina using data.census.gov


🦃 Thanksgiving and More


In the fall of 1621, the Pilgrims — early settlers of Plymouth Colony — held a three-day feast to celebrate a bountiful harvest. Many regard this as the nation's first Thanksgiving. The legacy of thanks and the feast have survived for centuries, with the event becoming a national holiday as of October 3, 1863.
🔎 Did you know? Thanksgiving is observed on the fourth Thursday of November. That’s November 24th this year.
🦃 There are 4 places named Turkey in the U.S. – a traditional holiday main course.
🥫 There are 5 places named Cranberry in the U.S. – a popular holiday side dish.
🛒 The six largest turkey producing states account for 69% of all turkeys produced according to the U.S Department of Agriculture.
🍗 Minnesota leads the way. The state was projected to raise 37.5 million turkeys in 2022.
Check Out Our Thanksgiving Fun Facts

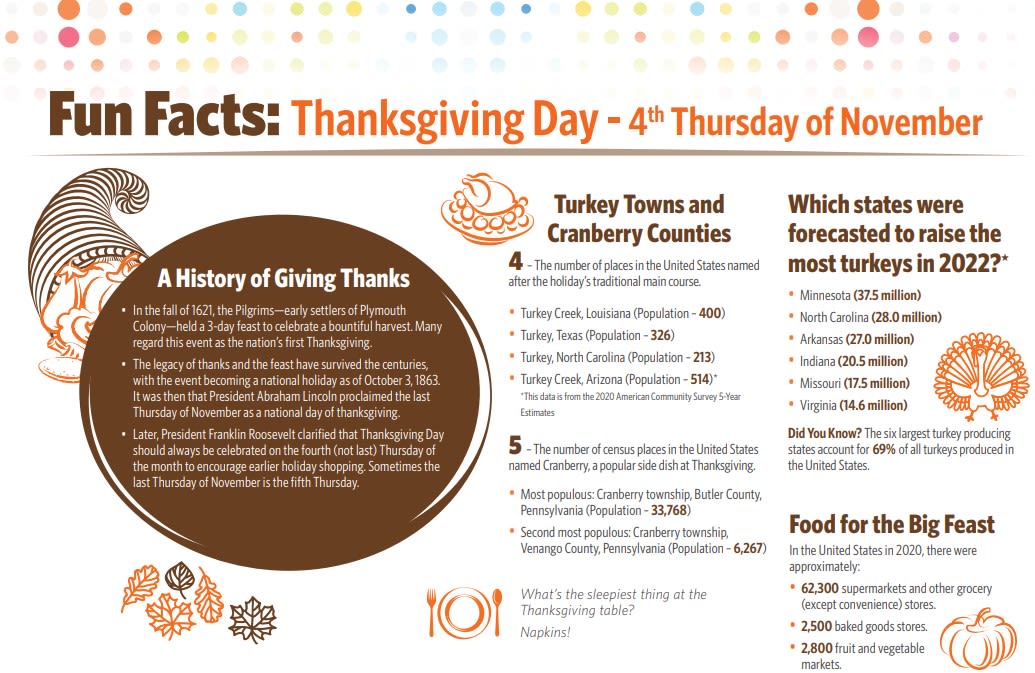
Use our Fun Facts resource in your classrooms or at home and share a variety of interesting Thanksgiving related facts with your students — from the number of turkey towns and cranberry counties in our country to the states that were forecasted to raise the most turkeys.
Test Your Trivia Knowledge

What’s your favorite thing about fall? 🍂 The changing colors of the leaves? 🍎 Apple picking? 🎃 Or carving pumpkins into jolly jack-o’-lanterns?
Test your knowledge on cool stuff like:
- The number of pumpkins and apples exported
- U.S. places with spooky-sounding names
- The state projected to raise the most turkeys— and more!


Do you know how many hobby, toy, and game stores there are in the U.S. or which three states have the most chocolate makers? Get into the holiday spirit year-round with this quiz that ties Census Bureau statistics to holidays celebrations.
Follow the Census Bureau on Social Media


Please use the links below to follow the Census Bureau on social media and sign up for important email updates.
U.S. Census Bureau Official Social Media Accounts
Facebook – @uscensusbureau
Twitter – @uscensusbureau
Twitter - @censusdirector
LinkedIn - U.S. Census Bureau
Instagram – @uscensusbureau
YouTube - U.S. Census Bureau
Sign Up for Email Updates