
Official websites use .gov
A .gov website belongs to an official government organization in the United States.
Secure .gov websites use HTTPS
A lock (
) or https:// means you’ve safely connected to the .gov website. Share sensitive information only on official, secure websites.

Topics
Data & Maps
Surveys & Programs
Resource Library
Advancing Equity with Data
Data for Equity
The Census Bureau is committed to producing data that depict an accurate portrait of America, including its underserved communities. Some of our data equity services include:
Demographic Data: We provide a wealth of data by key demographic variables such as race, ethnicity, sex, disability, income, and veteran status to help measure equity. These data are often by geography, which provides meaning and context to the statistical data, and can identify rural and underserved communities. Explore demographic data with our data tools such as data.census.gov.
Data Tools: We supply a variety of data tools that help the public and policy makers understand the issues surrounding inequities and enable them to propose effective, data-based solutions.
Public Assistance Program Metrics: Among other uses, Census Bureau data can provide metrics to show public assistance programs’ progress and outcomes.
Racial and Ethnic Diversity Measurement: We use several approaches to measure the racial and ethnic diversity of the U.S. population, including the diversity index, prevalence rankings, the diffusion score, and a series of prevalence maps.
Data Education: A major part of our mission is to educate the public, policy makers, and stakeholders on what data we have available and how to use them. To empower data users with understandable, accurate, and timely information and the knowledge to use it, we invite you to:
- Explore our online Census Academy for upcoming webinars and on-demand data training.
- Browse our Data Equity Library with its online collection of equity-related data visualizations, infographics, photos, audio, video, working papers and more.
Census Bureau data are valuable assets that can be used by policymakers and the public to advance equity.
Data Tools
ACCESS BROADBAND Dashboard
The ACCESS BROADBAND Dashboard displays maps for users to assess economic conditions in areas with changes in broadband availability and adoption.
Data Tool
Census Business Builder (CBB)
Census Business Builder offers small business owners selected Census Bureau & other statistics to guide their research for opening or expanding their business.
Community Resilience Estimates (CRE) Tools
The CRE provide easily understood metrics for how socially vulnerable every neighborhood is to the impacts of disasters and other stressors.
Data Tool
Digital Equity Act Population Viewer
Interactive collection of maps that highlight various demographics and broadband internet availability and adoption by state.
Data Tool
EDA (Economic Development Administration)-Census Poverty Status Viewer
This interactive tool measures high poverty areas and persistent poverty counties using data from the American Community Survey, SAIPE, and decennial census.
Data Tool
Emergency Management Hub
This portal provides quick access to demographic, economic, and resilience information for areas impacted by the latest significant emergency events in the U.S.
Experimental Data Product
Household Pulse Survey
The Household Pulse Survey is designed to deploy quickly, and efficiently collect data on emergent social and economic matters facing U.S. households.
Data Tool
Income and Poverty Interactive Data Tool
An interactive application for exploring data from the Small Area Income and Poverty Estimates (SAIPE) program.
Data Tool
Justice Outcomes Explorer Data Tool
Justice Outcomes Explorer (JOE) data measure the economic and health outcomes of people who have been involved with the criminal justice system.
Data Tool
Local Employment Dynamics
The LED Partnership leverages existing data in the development of new sources of economic and demographic information for policy makers and data users.
Data Tool
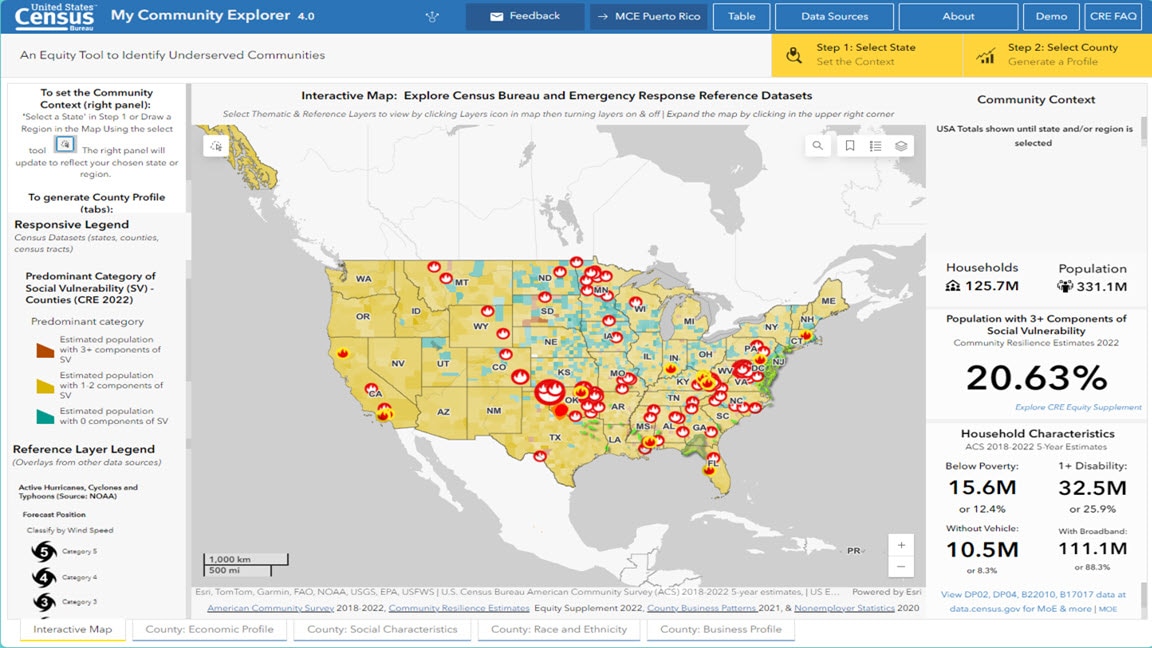
My Community Explorer
This tool combines select demographic, business, and resilience data to help users identify potentially underserved areas of their state, county, and community.
Data Tool
My Community Explorer for Puerto Rico
Interactive map-based tool with demographic & socioeconomic data showing capacity of individuals & households to absorb stresses of the impacts of a disaster.
Data Tool
Opportunity Atlas
Which neighborhoods in America offer children the best chance to rise out of poverty?
Data Tool
QuickFacts
QuickFacts provides frequently requested Census Bureau information at the national, state, county, and city level.
Data Tool
Response Outreach Area Mapper (ROAM)
The ROAM application was developed to make it easier to identify hard-to-survey areas.
How to Use Data Tools
Webinar
Exploring Census Data: Race & Ethnicity
This webinar includes a live demonstration on how to find key data and resources connected to race and ethnicity.
Tutorial
How Can I Access Data about Race and Ethnic Diversity?
In this Data Gem, you will learn how to access race and ethnic diversity data in 2010 and 2020 using an interactive data visualization.
Tutorial
How Can I Visualize Race and Hispanic Origin Data?
This Data Gem will teach you how to use an interactive data visualization to identify trends for the nation, state, and county.
Video
Accessing Community Resilience Estimates for Disaster Preparedness
Community resilience is the capacity of individuals and households to absorb, endure, and recover from the health, social, and economic impacts of a disaster.
Video
An Overview of the LEHD Data Program
LEHD data are the result of a partnership between the Census Bureau and U.S. states to provide high quality local labor market information.
Video
Hard to Count with ROAM
The Response Outreach Area Mapper (ROAM) application was developed to make it easier to identify hard-to-survey areas.
Press Release
Uninsured Health Rates Down in 627 Counties, Up in 23 Counties
The rate of Americans under age 65 without health insurance decreased in 627 counties and increased in 23 counties between 2021 and 2022.
Press Release
Opportunity Atlas Update
The Census Bureau released new data on changes in mobility, and a new interactive module in the Opportunity Atlas.
America Counts: Data Equity Stories
Income and Poverty
Shifts in Childhood Environment Shrink “Race Gaps,” Widen “Class Gaps”
New research shows the earnings gap between 27-year-old White adults born to low- and high-income parents widened while the low-income Black-White gap narrowed.
Population
Older Population Grew in Nearly All U.S. Metro Areas
New 2023 metro area population estimates by age show increases in older adults in almost all metro areas, with decreases in young people in many metro areas.
Income and Poverty
Majority of Older Adults in Poverty in 2021 Lived Alone
New Census Bureau report explores demographic characteristics, living arrangements and income sources of older adults living in poverty.
Population
Broadband Access in Tribal Areas Lags Rest of the Nation
Residents in tribal areas had a 6-point gap in broadband access compared to non-tribal residents in 2021, but the digital divide is narrowing.
Government
Bracing for an Active 2024 Hurricane Season
A look at Census Bureau data, maps and tools that can support emergency managers in disaster preparation and response.
Families and Living Arrangements
Over Half of Spouses in Same-Sex Marriages Tied the Knot After 2014
A new report provides characteristics and living arrangements of spouses in same-sex and opposite-sex couples.
Business and Economy
Exploring Two “First Look” Economic Datasets
Early data from the 2022 Economic Census and 2023 Annual Business Survey offer a glimpse of the number of employer businesses in the United States.
Families and Living Arrangements
How Many Young and Older Adults Lived Alone?
A new report shows how the living arrangements of adults varied by sex and across age groups.
Data Programs
American Community Survey (ACS)
The American Community Survey is the premier source for information about America's changing population, housing and workforce.
Annual Business Survey (ABS) Program
Provides annual data on select economic and demographic characteristics of employer businesses, including annual R&D estimates.
Household Pulse Survey
The Household Pulse Survey is designed to deploy quickly and efficiently to measure how emergent social and economic issues are impacting U.S. households.
Experimental Data Product
Post-Secondary Employment Outcomes (PSEO)
PSEO data provide earnings and employment outcomes for college and university graduates by degree level, degree major, and post-secondary institution
Experimental Data Product
Veteran Employment Outcomes
Veteran Employment Outcomes (VEO) are new experimental Census Bureau statistics on labor market outcomes for recent Army veterans.
Visualizations
Population
Hispanic or Latino Population as Percent of County Total Population
This graphic show the Hispanic or Latino Population as percent of county total population.
Population
Percent Change in the Hispanic or Latino Population by County
This graphic shows the percent change in the Hispanic of Latino population by county.
Population
Top 15 Largest-Gaining Cities
This visualization shows the top 15 largest-gaining cities by numeric change between July 1, 2022 and July 1, 2023.
Population
Top Fastest-Growing Cities
This visualization shows the top 15 fastest-growing cities by percent change between July 1, 2022 and July 1, 2023.
Population
Young Children in 2020: County Undercounts and Overcounts
Demographic analysis net coverage error estimates for children Ages 0-4.
Population
Young Children in 2020: State Undercounts
Demographic analysis net coverage error estimates for children ages 0-4.
Population
Celebrating Irish-American Heritage Month
This visualization shows counties with the highest populations of Irish ancestry.
Population
Women's Earnings
This graphic shows median earnings of full-time, year-round workers in the
past 12 months by sex and occupation.
Data Equity Resources
Related Topics
Income and Poverty
Income is the gauge many use to determine the well-being of the U.S. population. Survey and census questions cover poverty, income, and wealth.
Families and Living Arrangements
Our statistics highlight trends in household and family composition, describe characteristics of the residents of housing units, and show how they are related.
Education
This section provides information on a range of educational topics, from educational attainment and school enrollment to school districts, costs and financing.
Well-Being
Factors that contribute to well-being include income, possession of consumer durables, housing and neighborhood conditions, and the meeting of basic needs.
Business and Owner Demographic Characteristics
This page highlights the programs and surveys that provide demographic characteristics for employer and nonemployer businesses and business owners by sex, ethnicity, race, and veteran status.
State Data Center (SDC) Program
The State Data Center (SDC) Program was created to make data available locally to the public.
Census Partners
Census partners help America work better through data.
Census Open Innovation Labs
Trailblazing open government through cross-sector collaboration, design, and technology.
Census Information Centers (CIC)
The CIC Program provides local access, education and technical assistance on census data for planning and decision-making to underserved communities.
Page Last Revised - June 25, 2024
✕
Is this page helpful?
 Yes
Yes
 No
No
 Yes
Yes
 No
No✕
NO THANKS
255 characters maximum
 255 characters maximum reached
✕
Thank you for your feedback.
Comments or suggestions?

Comments or suggestions?