An official website of the United States government
Skip to main content
end of header
Census.gov
>
Business & Economy
>
Business Formation Statistics
>
Visualizations
>
Interactive Graphs
Skip to looking for section
Main
About
Data
Time Series/Trend Charts
Technical Documentation
Release Schedule
Definitions
FAQS
Contact Us
Back to Our Surveys & Programs
Main
About
Data
Time Series/Trend Charts
Technical Documentation
Release Schedule
Definitions
FAQS
Contact Us
Back to Our Surveys & Programs
Main
About
Data
Time Series/Trend Charts
Technical Documentation
Release Schedule
Definitions
FAQS
Contact Us
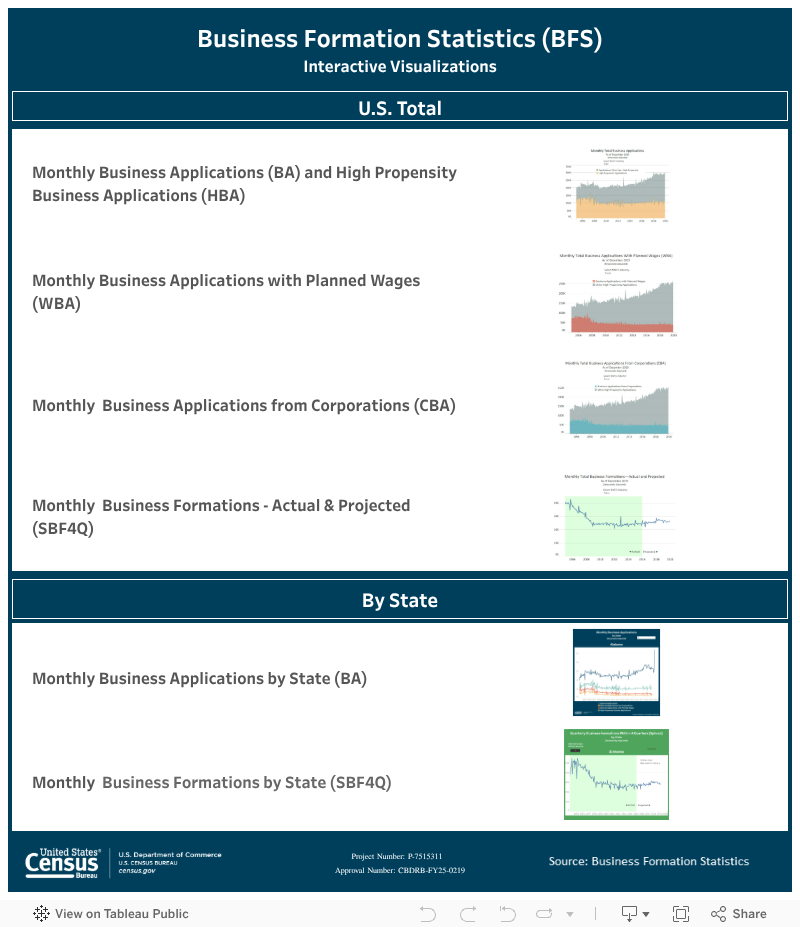
Monthly Interactive Visualizations
April 10, 2025
The BFS visualizations will not be updated until further notice. Please see data in the
Latest Monthly Business Formation Statistics Report
.
Last Revised: April 10, 2025