
Census.gov > Library > Infographics & Visualizations > 2013 > A Century of Population Change in the Age and Sex Composition of the Nation
Library
A Century of Population Change in the Age and Sex Composition of the Nation
September 12, 2013
An important tool for analyzing the age and sex composition of the population is the age-sex pyramid. This age-sex pyramid shows the number of males (on the left) and number of females (on the right) by single years of age.
A century of population change is shown so that population shifts in the shape of the pyramid can be more easily assessed at each point in time. The shape of the pyramid can give important information about the population’s composition. For example, the shapes of the pyramids over the latter part of the 20th century are more typical of developed countries: these feature a broad base with a middle section of nearly the same dimension that then gradually taper off at the oldest ages to a point at the top. The lopsided point at the top of the pyramid indicates differences in the number of males and females at older ages. This is a result of differences in mortality for men and women, where women tend to live longer than men. The Baby Boomer population can be seen in the pyramid as a bulge lasting from 1946 to 1964. The Baby Boom includes people born from mid-1946 to 1964. The Baby Boom is distinguished by a dramatic increase in birth rates following World War II and constitutes one of the largest generations in U.S. history.
SOURCE: Annual estimates of population by single year of age and sex 1900-2000
NOTE: The “tabletops” seen at 75 and 85 reflect data aggregation at the upper end of the range in early decades. National population data for the years 1900 to 1949 exclude the population residing in Alaska and Hawaii. Data for the years 1940 to 1979 cover the resident population plus Armed Forces overseas and for all other years cover only the resident population. The absence of the Armed Forces overseas population is visible in the young male population in 1917-1919. For more information about the annual estimates see the Population Estimates Program website at www.census.gov/programs-surveys/popest/data.html. To download the historical dataset used here see:
1900-1999: www.census.gov/data/tables/time-series/demo/popest/pre-1980-national.html
1980-1989: www.census.gov/data/datasets/time-series/demo/popest/1980s-national.html
1990-2000: www.census.gov/data/datasets/time-series/demo/popest/intercensal-1990-2000-national.html
Recent Data Visualizations
 Population Without Health Insurance
 Population Bracketology
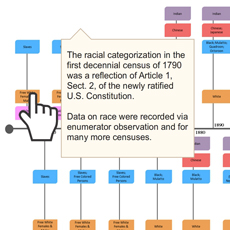 Measuring Race and Ethnicity Across the Decades: 1790-2010
  Where do college graduates work?
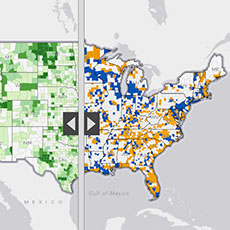 Story Maps Illustrate Population Change
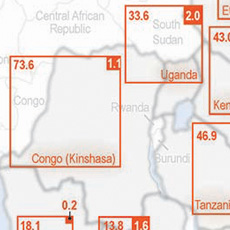 HIV/AIDS Impact in Africa
 Distribution of Hispanic or Latino Population by Specific Origin: 2010
 A Century of Population Change in the Age and Sex Composition of the Nation
  Shifting Occupational Shares
 Metro Area Density
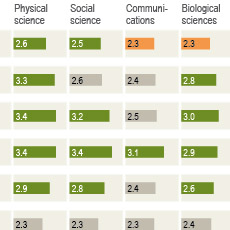 Work-Life Earnings
 Census Flows Mapper
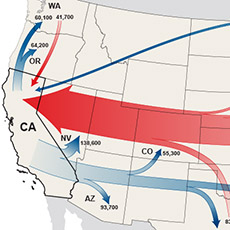 Migration Between Calif. & Other States
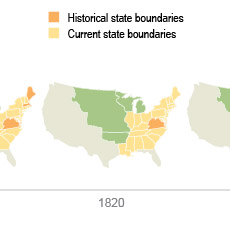 U.S. Territory and Statehood Status
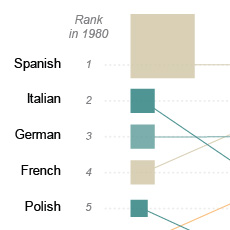 Spoken Languages Other than English
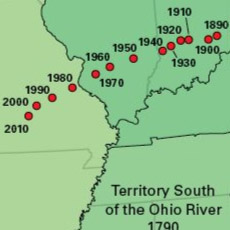 Center of Population, 1790-2010
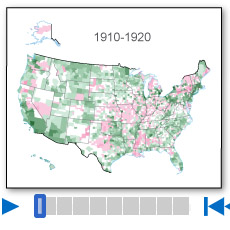 Population Change by Decade
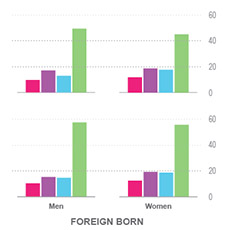 Without A High School Education
 A Decade of State Population Change
 State-to-State Migration for States of 8 Million or More
 Population Under 5 Years Old by Congressional District
 Components of Metro Area Change
 Blooming States
 Coastline County Population
 Coastline County Population
 I-90 Population Density Profile, 2010
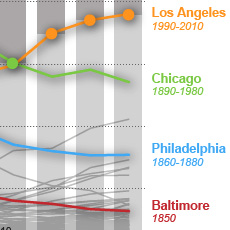 Second Cities: Keeping Pace with a Booming New York
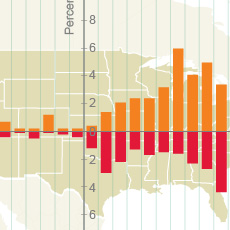 By the Grid: Population Shift to the West and South
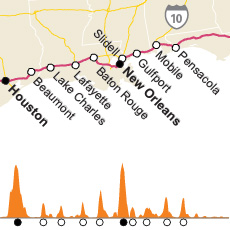 I-10 Population Density Profile, 2010
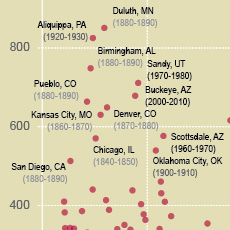 Booming Cities Decade-to-Decade, 1830-2010
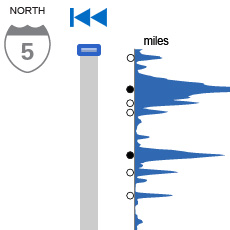 I-5 Population Density Profile, 2010
 Islands of High Income
 The Great Migration, 1910 to 1970
 Following the Frontier Line, 1790 to 1890
 Changing Ranks of States by Congressional Representation
 Cartograms of State Populations in 1890, 1950, and 2010
 Before and After 1940: Change in Population Density
 From Physical to Political Geography
 Differential City Growth Patterns
 I-95 Population Density Profile
 Increasing Urbanization
 Gaining and Losing Shares
 Top 20 Cities
Changing Ranks of States by Congressional RepresentationCartograms of State Populations in 1890, 1950, and 2010<