Census.gov > Library > Infographics & Visualizations > 2014 > Where do college graduates work?
Library
Where do college graduates work?
A Special Focus on Science, Technology, Engineering and Math
July 10, 2014
All Graduates
 STEM workers
 STEM-related workers
 Non-STEM workers
All STEM Majors
 STEM workers
 Non-STEM workers
Men
 STEM workers
 Non-STEM workers
Women
 STEM workers
 Non-STEM workers
White, not Hispanic
 STEM workers
 Non-STEM workers
Black or African American
 STEM workers
 Non-STEM workers
Asian
 STEM workers
 Non-STEM workers
Hispanic or Latino
 STEM workers
 Non-STEM workers
All Non-STEM Majors
 STEM workers
 Non-STEM workers
Men
 STEM workers
 Non-STEM workers
Women
 STEM workers
 Non-STEM workers
White, not Hispanic
 STEM workers
 Non-STEM workers
Black or African American
 STEM workers
 Non-STEM workers
Asian
 STEM workers
 Non-STEM workers
Hispanic or Latino
 STEM workers
 Non-STEM workers
View Data Table [XLS]
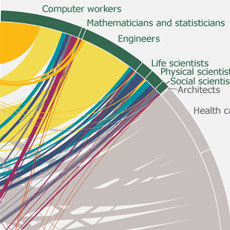
This interactive graphic allows you to explore the relationship between college majors and occupations. The length of each circle segment shows the proportion of people graduating in each college major and employed in each occupation group. The thickness of the lines between majors and occupations indicates the share of people in that major-occupation combination. Lines highlighted in color show the proportion of college graduates who work in STEM.
By hovering over a college major on the STEM Majors or Non-STEM Majors tab, you can see which occupations these graduates work in. You can also hover over an occupation to see which majors they hire from. These graphics show that only a minority of STEM majors are employed in STEM.
This visualization also lets you look at college major and employment patterns by sex, race, and Hispanic origin. It allows you to compare the relative size of each college major and occupation, as well as the proportion who are employed in STEM by these demographic characteristics. Comparing the graphics for men and women who are STEM majors, for example, we see that men are more likely to major in engineering and are more likely to be employed in STEM occupations.
DATA AND SOURCE:
Additional statistics on college graduates’ majors, occupations, earnings, and unemployment are available at: www.census.gov/data/tables/time-series/demo/industry-occupation/stem.html.
For more information on the STEM workforce, visit:
- The Relationship Between Science and Engineering Education and Employment in STEM Occupations
- Disparaties in STEM Employment by Sex, Race, and Hispanic Origin
SOURCE: U.S. Census Bureau, 2012 American Community Survey. The American Community Survey is a nationwide survey designed to provide communities with reliable and timely demographic, social, economic, and housing data for congressional districts, counties, places, and other localities every year. It has an annual sample size of about 3.5 million addresses. For information on confidentiality protection, sampling error, nonsampling error, and definitions, see www2.census.gov/programs-surveys/acs/tech_docs/accuracy/ACS_Accuracy_of_Data_2012.pdf.
DEFINITIONS
Field of degree corresponds to the bachelor’s degree major, or first-listed major among double-majors, for respondents aged 25 to 64 who have completed a bachelor’s or higher degree.
Occupation describes the kind of work a person does on the job. Occupations are classified according to the 2010 Standard Occupational Classification system maintained by the Standard Occupational Classification Policy Committee (SOCPC). In 2012, the SOCPC issued guidelines for the classification of science, technology, engineering, and math (STEM) workers. Based on this classification, STEM includes computer and mathematical occupations, engineers, engineering technicians, life scientists, physical scientists, social scientists, science technicians, and STEM managers. STEM-related occupations consist of architects, healthcare practitioners, healthcare managers, and healthcare technicians. Non-STEM occupations are all other occupations not classified in STEM or STEM-related occupations. The final recommendations are available online at www.bls.gov/soc/#crosswalks. The Census Bureau STEM code list is available at www.census.gov/topics/employment/industry-occupation/guidance/code-lists.html.
Race and Hispanic origin data are presented following the guidance of the U.S. Office of Management and Budget’s (OMB) 1997 Revisions to the Standards for the Classification of Federal Data on Race and Ethnicity. These federal standards mandate that race and Hispanic origin (ethnicity) are separate and distinct concepts and that when collecting these data via self-identification, two different questions must be used. Federal surveys now give respondents the option of reporting more than one race. Therefore, two basic ways of defining a race group are possible. A group such as Asian may be defined as those who reported Asian and no other race (the race-alone or single-race concept) or as those who reported Asian regardless of whether they also reported another race (the race-alone-or-in-combination concept). These graphics show data using the first approach (race alone). Use of the single-race population does not imply that it is the preferred method of presenting or analyzing data. The Census Bureau uses a variety of approaches. Estimates for the American Indian and Alaska Native, Native Hawaiian and Other Pacific Islander, Some Other Race, and Two or More Races populations are not shown because of a small number of sample observations. In the graphics presented here, the term “White, not Hispanic” refers to people who are not Hispanic and who reported White and no other race. The Census Bureau uses non-Hispanic Whites as the comparison group for other race groups and Hispanics. Because Hispanics may be any race, data presented for Hispanics overlap with data for racial groups.

