
Census Microdata API User Guide


The purpose of this guide is to provide an overview of the U.S. Census Bureau’s microdata application programming interface (API) and walk through how to make queries. Through this guide, you will learn what the microdata API is, when to use it, and how to use it to get raw data and custom statistics.
Limitations, Contact Us & Appendix
Limitations
Please be mindful of the following limitations when working with the microdata API.
Limitations for Get Queries
Queries for raw microdata with more than a few variables may not work unless you also restrict your geography or universe. This is because queries for raw microdata can request thousands or millions of records. When the data request is too large, it can cause the request to fail or time out.
If you are experiencing this issue, we recommend breaking up your API query into multiple API queries that only use a few variables at a time, or download the full set of data from the file transfer protocol (FTP) site for your dataset.
Limitations for Tabulate Queries
Queries for custom statistics may not satisfy all data needs due to some functionality limitations, challenges with the way variables are defined in a survey, and known defects.
- The process to recode variables is complex and subject to change. See the appendix for details.
- The microdata API does not currently have the functionality to:
- Calculate medians, percentages, or margins of error
- Apply inflation-adjustment variables like ADJINC to dollar values in ACS datasets
- Provide data over time in a single API query
- Calculate an average over time for monthly CPS datasets
- Results are being incorrectly formatted as exponents in API queries that only have variables in the rows. Until this issue is resolved, we recommend placing at least one variable in the columns for all tabulate queries.
- Place of work PUMAs (POWPUMAs), migration PUMAs (MIGPUMAs), and dual-vintage PUMAs are extremely difficult to use in tabulate queries because they are not available as geography predicates. ACS datasets with dual-vintage PUMAs include the 2015, 2014, 2013, and 2012 ACS 5-Year PUMS.
Contact Us
If you have questions about the microdata API, please email us at [email protected]
Appendix: How To Recode Variables
The microdata API offers the ability to recode variables to create custom categories that your statistics represent, rather than using the most detailed categories that are provided by default. This appendix walks through the process on how to recode variables. For a detailed explanation of why you would want to recode variables, please see the Recoding Variables section of this guide
Please be aware that the process to recode variables in the microdata API is complex and is subject to change in the future. We are considering ways to simplify the process to recode variables in the microdata API. If we implement a simplified syntax in the future, it will break the current way of recoding variables and users will need to update their microdata API queries to the new syntax for all of their queries that use recoded variables. To stay informed of these important API changes, please sign up for Census Data API email updates.
The microdata API allows you to recode variables using the format below. The parts of the example in bold will change depending on the variable and values you would like to use in your recode. The remaining characters are required parts of the parameter that you must include every time you recode a variable.
Recode Format
&recode+NEW_VARIABLE_ NAME={"b":"ORIGINAL_VARIABLE ", "d":[[CATEGORY 1],[CATEGORY 2]]}
In this structure:
- NEW_VARIABLE_NAME = A new label you must create for your recoded variable
- b = base variable
- ORIGINAL_VARIABLE = The name of the variable you recoded, as it appears on the variables page for a dataset in the microdata API
- d = definition
- [CATEGORY 1],[CATEGORY 2] = The definition of the number of categories for your recoded variable along with the values that each category represents
Example: Recoding AGEP to provide data for people age 0-11 and people age 12 and over:
&recode+AGEGROUPS={"b":"AGEP", "d":[[0,1,2,3,4,5,6,7,8,9,10,11],[{"mn":12,"mx":99}]]}
- AGEGROUPS = A new label for the recoded variable
- AGEP = The original name of the age variable in the 2019 ACS 1-Year PUMS dataset
- [0,1,2,3,4,5,6,7,8,9,10,11],[{"mn":12,"mx":99}] = The definition of the recoded categories and values. This example has two categories: The first provides data for people age 0-11 and the second provides data for people age 12 and over.
- mn = minimum value of range
- mx = maximum value of range
Let’s take a deep dive into the rules for defining recoded variables. This will explain why [0,1,2,3,4,5,6,7,8,9,10,11],[{"mn":12,"mx":99}] provides data for two categories: people age 0-11 and people age 12 and over.
Defining the number of categories
Square brackets and commas tell the API how many categories to include in a recoded variable.
[CATEGORY 1],[CATEGORY 2]
- Enclose each recoded category in square brackets []
- Separate each category with a comma
Defining values for each category
Individual values or ranges within a square bracket tell the API which values to include in a category.
Example: [0,1,2,3,4,5,6,7,8,9,10,11],[{"mn":12,"mx":99}]
Within each set of square brackets, you must:
- Specify one or more values that you want to include in the recoded category
- Use a comma to separate each value or range of values in your definition
You may define values in a few different ways if you are working with numerical values from integer or float variables. For example, you could create a category for people age 0-11 by:
- Listing each value individually: [0,1,2,3,4,5,6,7,8,9,10,11]
- Defining a range: [{"mn":0,"mx":11}]
- A combination of both methods: [0,1,{"mn":2,"mx":11}]
When defining categories for string variables, list out each value individually. String variables may contain a mixture of alphanumerical characters, which means it is not possible to define a logical range.
You must use straight double quotation marks " to enclose all non-numerical text that appears within the curly brackets in the recode parameter.
Once you recode the variable, you will need to encode the text that appears after the equals sign in the recode parameter. This is needed because some of the special characters such as the brackets and quotes cannot be read by the API. Encoding this part of the API query will replace the special characters with a set of standard characters that the API is able to read to represent the special characters.
Original Text:
&recode+AGEGROUPS={"b":"AGEP", "d":[[0,1,2,3,4,5,6,7,8,9,10,11],[{"mn":12,"mx":99}]]}
Encoded Text: &recode+AGEGROUPS=%7B%22b%22%3A%22AGEP%22%2C%20%22d%22%3A%5B%5B0%2C1%2C2%2C3%2C4%2C5%2C6%2C7%2C8%2C9%2C10%2C11%5D%2C%5B%7B%22mn%22%3A12%2C%22mx%22%3A99%7D%5D%5D%7D
 |
Please be sure to only encode the portion of the recode that appears after the equals sign in the recode parameter. This is the part within and including the curly brackets. If you encode other additional characters, the API query will not work. |
In the example above:
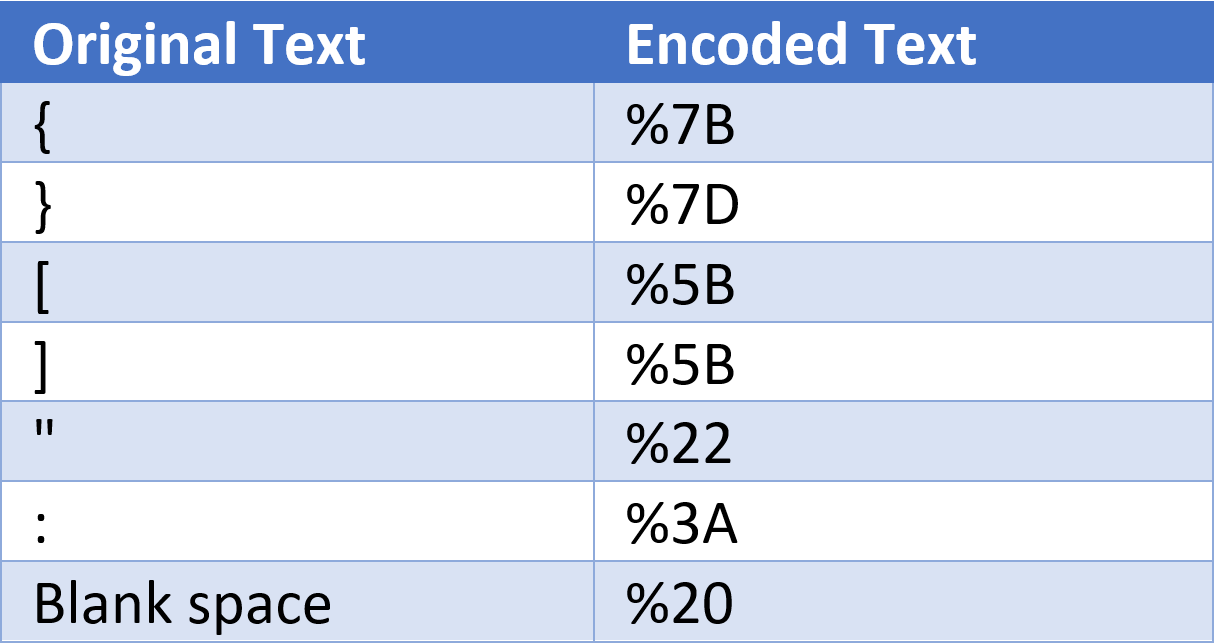
Rather than replacing these characters manually, we recommend using an encoding tool to transform the special characters all at once with a click of a button. Free encoding tools are easy to find on the internet and can complete this process for you very quickly.
The last step is to add a recoded variable to a tabulate query. Simply add the properly encoded recode parameter to your microdata API query, and the recoded variable to the columns or rows using the new variable name.
For example, suppose you want to look at health insurance status for people age 0-11 compared to people age 12 and over. You will add this to the API query:
<api.census.gov/data/2019/acs/acs1/pums?tabulate=weight(PWGTP)&row+AGEGROUPS&col+HICOV&recode+AGEGROUPS=%7B%22b%22%3A%22AGEP%22%2C%20%22d%22%3A%5B%5B0%2C1%2C2%2C3%2C4%2C5%2C6%2C7%2C8%2C9%2C10%2C11%5D%2C%5B%7B%22mn%22%3A12%2C%22mx%22%3A99%7D%5D%5D%7D&key=your key here>
Notice this includes:
- The predicate to add the recoded variable to the rows of the results:
&row+AGEGROUPS
- The properly encoded recode parameter:
&recode+AGEGROUPS=%7B%22b%22%3A%22AGEP%22%2C%20%22d%22%3A%5B%5B0%2C1%2C2%2C3%2C4%2C5%2C6%2C7%2C8%2C9%2C10%2C11%5D%2C%5B%7B%22mn%22%3A12%2C%22mx%22%3A99%7D%5D%5D%7D
The results provide a custom table based on the 2019 ACS 1-Year PUMS. The first row of data tells us there were an estimated 2,397,369 children age 0-11 without health insurance, and 45,154,935 children age 0-11 with health insurance. The second row of data provides these results for people 12 and over.
[[{"HICOV": "2"}, {"HICOV": "1"},"AGEGROUPS"],
[2397369,45154935,"1"],
[28605927,252081292,"2"]]
Below are some other examples of recoding variables. They show that the recode functionality can be used to recode more than two categories, multiple variables, and different types of continuous and categorical variables.
Travel Time to Work
Recode JWMNP to get data for travel time to work broken out in 8 categories: 0 (not a worker or work from home), 1-14 min, 15-29 min, 30-44 min, 45-59 min, 60-74 min, 75-89 min, or 90+ min
Original Recode Parameter
&recode+COMMUTE={"b":"JWMNP","d":[[00],[{"mn":1,"mx":14}],[{"mn":15,"mx":29}],[{"mn":30,"mx":44}],[{"mn":45,"mx":59}],[{"mn":60,"mx":74}],[{"mn":75,"mx":89}],[{"mn":90,"mx":200}]]}
Encoded Recode Parameter
&recode+COMMUTE=%7B%22b%22%3A%22JWMNP%22%2C%22d%22%3A%5B%5B00%5D%2C%5B%7B%22mn%22%3A1%2C%22mx%22%3A14%7D%5D%2C%5B%7B%22mn%22%3A15%2C%22mx%22%3A29%7D%5D%2C%5B%7B%22mn%22%3A30%2C%22mx%22%3A44%7D%5D%2C%5B%7B%22mn%22%3A45%2C%22mx%22%3A59%7D%5D%2C%5B%7B%22mn%22%3A60%2C%22mx%22%3A74%7D%5D%2C%5B%7B%22mn%22%3A75%2C%22mx%22%3A89%7D%5D%2C%5B%7B%22mn%22%3A90%2C%22mx%22%3A200%7D%5D%5D%7D
API Query
<api.census.gov/data/2019/acs/acs1/pums?tabulate=weight(PWGTP)&row+COMMUTE&col+SEX&recode+COMMUTE=%7B%22b%22%3A%22JWMNP%22%2C%22d%22%3A%5B%5B00%5D%2C%5B%7B%22mn%22%3A1%2C%22mx%22%3A14%7D%5D%2C%5B%7B%22mn%22%3A15%2C%22mx%22%3A29%7D%5D%2C%5B%7B%22mn%22%3A30%2C%22mx%22%3A44%7D%5D%2C%5B%7B%22mn%22%3A45%2C%22mx%22%3A59%7D%5D%2C%5B%7B%22mn%22%3A60%2C%22mx%22%3A74%7D%5D%2C%5B%7B%22mn%22%3A75%2C%22mx%22%3A89%7D%5D%2C%5B%7B%22mn%22%3A90%2C%22mx%22%3A200%7D%5D%5D%7D&key=your key here>
Output
Results provide the total number of males and females in each of the 8 commuting categories. Specifically, the 8 COMMUTE values represent each of the categories you recoded, and they are ordered the same way you specified them. For example, COMMUTE=1 refers to people with a JWMNP value of 0 (not a worker or work from home) because it was the first category defined in the recode. COMMUTE=2 refers to people who have a 1-14 min travel time to work because it was the second category defined in the recode.
[{"SEX": "1"}, {"SEX": "2"},"COMMUTE"],
[83231328,97001692,"1"],
[18041733,18669298,"2"],
[27137539,25546648,"3"],
[17133339,14231984,"4"],
[7181282,5499790,"5"],
[5010477,3402857,"6"],
[901051,597099,"7"],
[2957523,1695883,"8"]]
The second row of the data shows that based on the 2019 ACS 1-Year PUMS, there were approximately 18,041,733 men and 18,669,298 women with commute times of 1-14 min in the United States.
Age and Poverty
Recode poverty by age from the 2020 CPS ASEC microdata:
- Recode A_AGE to get data for 2 age categories: People 0-61 and people 62 and over
- Recode PERLIS to get data for 2 poverty categories: In poverty and not in poverty
Original Recode Parameters
&recode+AGEGROUP={"b":"A_AGE","d":[[{"mn":0,"mx":61}],[{"mn":62,"mx":85}]]}
&recode+POVERTY={"b":"PERLIS","d":[[1],[2,3,4]]}
Encoded Recode Parameters
&recode+AGEGROUP=%7B%22b%22%3A%22A_AGE%22%2C%22d%22%3A%5B%5B%7B%22mn%22%3A0%2C%22mx%22%3A61%7D%5D%2C%5B%7B%22mn%22%3A62%2C%22mx%22%3A85%7D%5D%5D%7D
&recode+POVERTY=%7B%22b%22%3A%22PERLIS%22%2C%22d%22%3A%5B%5B1%5D%2C%5B2%2C3%2C4%5D%5D%7D
API Query
<api.census.gov/data/2020/cps/asec/mar?tabulate=weight(MARSUPWT)&col+POVERTY&row+AGEGROUP&recode+AGEGROUP=%7B%22b%22%3A%22A_AGE%22%2C%22d%22%3A%5B%5B%7B%22mn%22%3A0%2C%22mx%22%3A61%7D%5D%2C%5B%7B%22mn%22%3A62%2C%22mx%22%3A85%7D%5D%5D%7D&recode+POVERTY=%7B%22b%22%3A%22PERLIS%22%2C%22d%22%3A%5B%5B1%5D%2C%5B2%2C3%2C4%5D%5D%7D&key=your key here>
Output
Results provide the total number of people in poverty and the total number of people not in poverty across both age groups. In this output, the 2 AGEROUP values represent each of the categories you recoded, and they are ordered the same way you specified them. For example, AGEGROUP=1 refers to people age 0-61 because it was the first category defined in the recode. AGEGROUP=2 refers to people age 62 and over because it was the second category defined in the recode.
[[{"POVERTY": "1"}, {"POVERTY": "2"},"AGEGROUP"],
[27942761,229606212,"1"],
[6041575,61163321,"2"]]
The first row of the data show that based on the 2020 CPS ASEC, there were approximately 27,942,761 people age 0-61 in poverty and 229,606,212 people age 0-61 not in poverty in the United States.
Hourly Earnings
Recode hourly earnings from the December 2020 CPS Basic Monthly microdata:
- Recode PTERNHLY to get data for 3 wage categories: People with an hourly wage of $0.01-$7.24, people with an hourly wage of $7.25, and people with an hourly wage above $7.25.
Original Recode Parameter
&recode+HOURLYWAGE={"b":"PTERNHLY","d":[[{"mn":0.01,"mx":7.24}],[{"mn":7.25,"mx":7.25}],[{"mn":7.26,"mx":99.99}]]}
|
Remember to add a leading zero before decimal values between -1 and 1, such as 0.01. |
Encoded Recode Parameter
&recode+HOURLYWAGE=%7B%22b%22%3A%22PTERNHLY%22%2C%22d%22%3A%5B%5B%7B%22mn%22%3A0.01%2C%22mx%22%3A7.24%7D%5D%2C%5B%7B%22mn%22%3A7.25%2C%22mx%22%3A7.25%7D%5D%2C%5B%7B%22mn%22%3A7.26%2C%22mx%22%3A99.99%7D%5D%5D%7D
API Query
<api.census.gov/data/2020/cps/basic/dec?tabulate=weight(PWORWGT)&col+HOURLYWAGE&recode+HOURLYWAGE=%7B%22b%22%3A%22PTERNHLY%22%2C%22d%22%3A%5B%5B%7B%22mn%22%3A0.01%2C%22mx%22%3A7.24%7D%5D%2C%5B%7B%22mn%22%3A7.25%2C%22mx%22%3A7.26%7D%5D%2C%5B%7B%22mn%22%3A7.2%2C%22mx%22%3A99.99%7D%5D%5D%7D&key=your key here>
Output
Results provide the total number of people in each of the 3 hourly wage categories: $0.01-$7.24 per hour, $7.25 per hour, and above $7.25 per hour. In this output, the 3 HOURLYWAGE values represent each of the categories you recoded, and they are ordered the same way you specified them. For example, HOURLYWAGE=1 refers to people with an hourly wage of $0.01-$7.24 per hour because it was the first category defined in the recode.
[[{"HOURLYWAGE": "1"}, {"HOURLYWAGE": "2"}, {"HOURLYWAGE": "3"}],
[656108,152949,76224331]]
The first row of the data shows that based on the December 2020 CPS Basic Monthly, there were approximately 656,108 people with an hourly wage of $0.01-$7.24, 152,949 people with an hourly wage of $7.25, and 76,224,331 people with an hourly wage above $7.25.
Related Information
-
How-to Materials for Using the Microdata AccessDo you have questions on how to use Microdata Access? Check out our step-by-step guidance to learn how to use Microdata Access to create your own tabulations.
-
Microdata AccessCreate custom tables using public use microdata with the Microdata Access Tool (MDAT).