SPECIAL NOTE ABOUT THE WEEKLY BFS METHODOLOGY: Weekly BFS series are created using the same methodology as the Monthly BFS estimates described below. The weekly data provide timely and granular information on the state of the economy but appropriate caution is required in interpreting fluctuations since high-frequency weekly data are subject to fluctuations from seasonal factors including holidays and beginning and end of calendar year effects.
The weekly BFS data are not seasonally adjusted. For a limited time, BFS data will be provided at the national, regional, and state levels. No business formation series are created on a weekly basis. Due to the rounding, weekly series may exhibit less variability than the actual series, especially for states with a small number of business applications. The rounded weekly BFS series will not add up to the Monthly BFS estimates.
SPECIAL NOTE ABOUT PUERTO RICO AND ISLAND AREAS BFS METHODOLOGY: The business formations series are not available for Puerto Rico and the Island Areas, only the business applications series. Puerto Rico and Island Areas business applications series are not included in national or regional business applications series.
Business Formation Statistics (BFS) are a product of the U.S. Census Bureau developed at the Center for Economic Studies in research collaboration with economists affiliated with Board of Governors of the Federal Reserve System, Federal Reserve Bank of Atlanta, University of Maryland, and University of Notre Dame.
BFS provide timely and high-frequency data on business applications and employer business formations. BFS measure business initiation activity (Business Application Series) as indicated by applications for an Employer Identification Number (EIN) on the IRS Form SS-4. BFS also provide information on actual and projected employer business formations (Business Formation Series) that originate from these applications, based on the record of first payroll tax liability for an EIN. In addition, BFS contain measures of delay in business starts as indicated by the average duration between the application for an EIN and the transition to an employer business.
BFS currently cover the period starting from July 2004 onwards at a monthly frequency. The data are available nationally and by individual states.
The data for BFS come from three main sources. The data on business applications are based on applications for an Employer Identification Number (EIN) through filings of IRS Form SS-4. Employer business formations originating from these business applications are identified using the Census Bureau's Business Register (BR) and the Longitudinal Business Database (LBD), which together provide information on the timing of first payroll tax filing for a business based on tax records. The BR is the Census Bureau's main sampling frame for the universe of U.S. businesses and contains quarterly payroll and employment information for employer businesses. The LBD is constructed by linking annual snapshot files from the BR to provide a longitudinal history for each business establishment (Jarmin and Miranda (2002)). Through these linkages, the LBD is able to provide information on the first-ever appearance of a business in the BR as a business with payroll or employment.
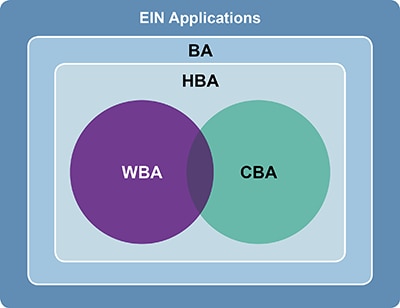
These series describe the business applications for tax IDs as indicated by applications for an Employer Identification Number (EIN) through filings of IRS Form SS-4. Business applications are presented in four different series reflecting different subsets of the applications for an EIN. All business applications series cover the period from 2004 JUL onwards. All Puerto Rico and Island Areas business applications series are not included in national and regional business applications series.
The following is a Venn diagram of the relationship between the four business applications series (BA, HBA, WBA, CBA) and EIN applications.
These series describe employer business formations as indicated by the first instance of payroll tax liabilities for the corresponding business applications. The business formations series are forward-looking in the sense that they measure new business formations from the time of business application in any given quarter. Two series are provided: the first describes transitions within the next four quarters (12 months), and the second within the next eight quarters (24 months). Puerto Rico and the Island Areas are not included in the business formations series. All available business formations series start in 2004 JUL, the earliest quarter for which the data on business applications is available.
The information submitted by applicants in the IRS Form SS-4 for an EIN application is used to model employer projected business formation for the U.S. economy as a whole and for individual states. Let Ngt be the number of new applications in a geographic region g (e.g., a state or the entire U.S.) in quarter t. The total number of business formations that occur between quarters t and t + k from these applications is then given by
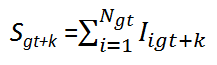
where Iigt+k is a realization of a Bernoulli random variable that governs whether application i turns into an employer business by the end of quarter t + k. The probability distribution function for Iigt+k is given by
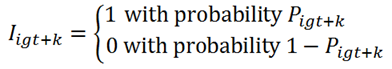
where Pigt+k is the probability that application igt turns into an employer business between quarters t and t + k. Then, the expected number of business formations can be written as
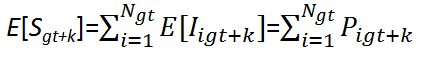
To estimate E[Sgt+k], an estimate of Pigt+k is needed. Towards that goal, one can model Iigt+k as a function of application-level variables, Zigt, provided as part of an EIN application in the IRS Form SS-4 and a set of unknown parameters, ßgt. Using a Linear Probability Model (LPM), the probability of an application transitioning to an employer can then be estimated as
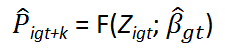
where F is a linear function, and  is an estimate of the unknown parameters, ßgt, based on the LPM. The predicted application-level probabilities,
  , can be used to construct an estimate of the expected number of business formations, E[Sgt+k], as

This approach amounts to reweighting each application by the predicted probability that the application becomes an employer business between quarters t and t + k. In the analysis, k is set to either four or eight, corresponding to four and eight quarters, respectively. The four and eight quarter windows were chosen to allow a long enough time for an application to become an employer business and cover a majority of transitions to employer business. These choices prevent a significant loss of information due to right censoring - some applications transition beyond the four or eight quarter window. The estimated expected number of business formations are used to generate the series Projected Business Formations within 4 Quarters (PBF4Q) and Projected Business Formations within 8 Quarters (PBF8Q). For further details on the estimation methodology, see Bayard, Dinlersoz, Dunne, Haltiwanger, Miranda, and Stevens (2018).
The Census Bureau classifies BFS data by industry using the North American Industry Classification System (NAICS). NAICS codes are assigned using a variety of sources. A Census Bureau-developed automated industry-coding program first attempts to assign NAICS codes to all new EIN applications received from the IRS. The automated industry-coding program is based on established patterns in the business name and descriptions provided on the EIN applications. This auto-coding process assigned NAICS codes to over 80% of all incoming EIN applications in 2020. For applications that did not receive a NAICS code during the auto-coding process, BFS staff use a Census-developed machine learning algorithm to assign NAICS codes where possible. NAICS codes are revised each year for the previous five years as part of the BFS annual update process when more accurate and detailed NAICS codes may be available from the Social Security Administration, the Bureau of Labor Statistics, and the Census Bureau's Business Register. There are a small number of EIN applications where there is not enough information available to assign a NAICS code through any source.
Please read this paper for more information about the Census Bureau automated industry-coding program. This presentation provides more information on the machine learning algorithm.
In addition to revising NAICS codes assignments, every five years a new vintage of NAICS codes is implemented to keep the classification system current with changes in economic activities. BFS switched from the 2017 NAICS vintage to the 2022 NAICS vintage during the 2025 annual update, published in February 2026. The conversion to 2022 NAICS resulted in minor revisions reflecting content and coding changes within the Mining and Logging, Manufacturing, Wholesale Trade, Financial Activities, and other services sectors, as well as major revisions reflecting content and coding changes in the Retail Trade and Information sectors. Because of these major revisions, we pushed the 2022 NAICS code all the way back to the start of the time series, instead of revising just the most recent five years. As the monthly BFS product publishes NAICS at the two-digit level, the impact of implementing the 2022 NAICS vintage is minimal. Most changes will appear in the annual weekly NAICS data published at the three-digit NAICS level. The first annual weekly NAICS publication using the 2022 NAICS vintage was released in March 2026 and is accompanied by a one-time weight table bridging the 2017 and 2022 NAICS vintages.
The Business Dynamic Statistics (BDS) program of the Census Bureau also provides information on new employer businesses at annual frequency. However, there are some key differences in how BDS and BFS account for new business formation. First, BDS use employment rather than payroll to identify new businesses. Employment in BDS is a point-in-time measure. BDS capture employment as of the payroll week covered by March 12 of the year. BFS, by contrast, use the presence of payroll as a measure of business formation activity. In addition, BFS are based on a quarterly measure of payroll within each year. The quarterly frequency leads to timing differences with respect to BDS in the identification of business startups that hired their first employee after the payroll week of March 12. Second, because of left censoring in the business applications, BFS do not account for employer business formations that originate from EIN applications dated before 2004 JUL. This effect, however, dissipates toward the end of the sample period, as nearly all business formations eventually tend to arise from business applications made since 2004 JUL. For these reasons, BDS annual count of new employer businesses do not exactly match the corresponding count in BFS, but they track each other closely.
Because BFS are constructed using a combination of administrative data, rather than a probability sample, sampling error does not apply to BFS. Non-sampling error, however, still exists. Non-sampling errors can occur for many reasons, such as the employer submitting corrected payroll or employment data after the end of the year as well as late filers. Other sources of error include typographical errors made by businesses when providing information on the survey or administrative forms. Such errors, however, are likely to be distributed randomly throughout the dataset.
There is also projection error in the projected number of business formations based on the econometric models. It is possible to provide measures of error and confidence bands for the projected number of business formations, and such measures will be considered for future versions of BFS.
Changes in administrative data sometimes can also create complications in identifying business startups with payroll. The Longitudinal Business Database (LBD) addresses these issues in detail in order to avoid overstating business openings (Chow et al. (2021)).The BFS formation series are revised annually based on corrections to the LBD due to updates coming from the new BR files. The updated formations data are typically released by the publication of December monthly data. There are also some changes in the content of the IRS Form SS-4 over time, and new information in the form is incorporated into the analysis as it becomes available.
BFS periodically evaluates the characteristics associated with high-propensity applications and their likelihood to turn into a business formation. The evaluation may result in updates to the definition of high-propensity applications. In November 2021, the definition for high-propensity business applications was updated and applied to data from 2012-current. This update was made possible in part by the NAICS improvement methodology discussed above.
new HBA: High-Propensity Business Applications - Business Applications (BA) that have a high-propensity of turning into businesses with payroll. The identification of high-propensity applications is based on the characteristics of applications revealed on the IRS Form SS-4 that are associated with a high rate of business formation. High-propensity applications include applications: (a) from a corporate entity, (b) that indicate they are hiring employees, (c) that provide a first wages-paid date (planned wages); or (d) that have a NAICS industry code in accommodation and food services (72) or in portions of construction (237, 238), manufacturing (312, 321, 322, 332), retail (44, 452), professional, scientific, and technical services (5411, 5413), educational services (6111), and health care (621, 623).
The characteristics associated with high-propensity business applications were first determined during initial BFS program research. The original definition for high-propensity business applications is more representative of the older data and is applied to the data from 2004-2011.
original HBA: High-Propensity Business Applications - Business Applications (BA) that have a high-propensity of turning into businesses with payroll. The identification of high-propensity applications is based on the characteristics of applications revealed on the IRS Form SS-4 that are associated with a high rate of business formation. High-propensity applications include applications: (a) from a corporate entity, (b) that indicate they are hiring employees, purchasing a business or changing organizational type, (c) that provide a first wages-paid date (planned wages); or (d) that have a NAICS industry code in manufacturing (31-33), a portion of retail (44), health care (62), or accommodation and food services (72).
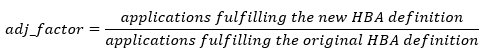
In order to keep the data between the definitions comparable, the original definition of high-propensity applications has an additional linking methodology applied. We did so by maintaining the growth rate of the time series but raising or lowering the level of the original definition series, increasing or decreasing its weight in the aggregation hierarchy. This method is known as retrapolation, see the Handbook on Backcasting for more information.
An adjustment factor was calculated using a simple ratio of the new HBA definition over the original HBA definition, for each month in an overlap year, 2012.
The mean adjustment factor was then calculated across all months of 2012.
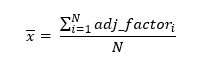
The mean adjustment factor was then applied, via multiplication, to the data with the original HBA definition (2004-2011). For the years 2004-2011, the HBA data in our publications have retrapolation applied.

The adjustment factor is computed at the state-level for the NSA HBA data. The region and national NSA HBA totals are tabulated from this state-level data. For the industry NSA HBA data, separate adjustment factors for each industry are computed. Seasonal adjustment methodology is applied to the updated spliced series.
During the most recent periodic evaluation of the definition of HBA, it was decided to remove applications indicating they came from a corporation with an internet sales NAICS industry. After noticing a spike in these cases, we researched whether these applications were forming businesses with employees. Historically, these applications had low transition rates to employer businesses and have limited instances of quarterly payroll according to the BR. The original research used to define HBA was based on industries that had a high likelihood of transitioning to businesses. These applications also indicated they were from a corporation, which is another component of the HBA definition. Due to the low transition rates to employer businesses, internet sales applications were removed from both CBA and HBA time series during the 2025 annual update, published in February 2026.
Seasonal adjustment is the process of estimating and removing seasonal effects from a time series to better reveal certain nonseasonal features. Examples of seasonal effects include a July drop in automobile production as factories retool for new models and increases in heating oil production during September in anticipation of the winter heating season. When applicable, we also estimate and remove trading day effects and moving holiday effects (e.g., Easter, Labor Day, etc.) during the seasonal adjustment process. Trading day effects are recurring effects related to the weekday composition of the month. Because of strong seasonality detected in most of the business application and formation series, all series are provided with and without seasonal adjustment. Each month adjusted application and formation series are revised on for the prior two months, as well as the current and previous month in the prior year. For example, with the release of September 2021 data, the following months would be revised: August 2021, July 2021, September 2020, and August 2020. Factors for seasonal adjustments are recomputed and the seasonally adjusted applications and formations series are revised annually.
In the case of the duration series (DUR4Q and DUR8Q), seasonality is not significant in general. Therefore, no seasonally adjusted duration series are provided. All data, with the exception of the industry data and the weekly data, are seasonally adjusted at the state level and summed to create seasonally adjusted United States total and regional data. Industry data, except for Utilities (22), is seasonally adjusted at the national level to create adjusted United States totals.
During the seasonal adjustment process, industry-level estimates are raked to the United States total, in order to ensure consistency with total estimates at the national level. this raking process may introduce a rounding error to data early in the time series, and in some cases, forces HBA to be greater than BA.
Seasonal adjustment is performed concurrently using the X-13ARIMA-SEATS seasonal adjustment program of the U.S. Census Bureau. Concurrent seasonal factors result from re-estimating the seasonal adjustment each month or quarter when the new time series values become available. For more information on X-13ARIMA-SEATS, see the reference manuals posted on the Census Bureau's website. An assumption underlying the seasonal adjustment process is that the original series can be separated into a seasonal component, a trend-cycle component, and an irregular component, and possibly a trading day component and/or moving holiday component. The seasonally adjusted series consists of the trend-cycle and irregular components taken together. The trend-cycle component includes the long-term trend and the business cycle. The irregular component is made up of residual variations, such as the sudden impact of political events and the effects of strikes, unusual weather conditions, reporting and sampling errors, etc. Users can implement their own seasonal adjustment methods using the unadjusted data. User's results may differ from those published due to rounding. The Census Bureau rounds in the final step after running seasonal adjustment.
Disclosure is the release of data that reveals information or permits deduction of information about a particular survey unit through the release of either tables or microdata. Disclosure avoidance is the process used to protect each unit's identity and data from disclosure. Using disclosure avoidance procedures, the Census Bureau modifies or removes the characteristics that put information at risk of disclosure. Although it may appear that a table shows information about a specific unit, the Census Bureau has taken steps to disguise or suppress a unit's data that may be "at risk" of disclosure while making sure the results are still useful.
For the annual counts of state by county business applications, the Census Bureau implemented differentially private geometric noise into counts for all counties. For theory and development in differential privacy, refer to Haney et al. 2017 and references therein. In addition to injecting noise, the Census Bureau rounded up negative values to zero and made invariant the number of BAs within each state. Since previously released state totals are available and post-processing outputs does not degrade the privacy, we calibrate the county BA counts to the published state totals. There is no sampling weight and the global sensitivity for the count data is one. We use a privacy budget of 0.5 for years 2005 through 2018, and .75 for years 2019 and beyond. Annual Business Applications by County data for 2005 - 2025 used differential privacy as the primary disclosure avoidance method. For future publications, disclosure avoidance methods will align with U.S. Department of Commerce Administrative Order Disclosure Avoidance for Statistical Products.
The Census Bureau has reviewed the monthly data product (including Puerto Rico) to ensure appropriate access, use, and disclosure avoidance protection of the confidential source data (Project No. P-7515311, Disclosure Review Board (DRB) approval number: CBDRB-FY26-0112).
The Census Bureau has reviewed the weekly data product to ensure appropriate access, use, and disclosure avoidance protection of the confidential source data (Project No. P-7515311, Disclosure Review Board (DRB) approval number: CBDRB-FY26-0108).
The Census Bureau has reviewed quarterly data product to ensure appropriate access, use, and disclosure avoidance protection of the confidential source data (Project No. P-7515311, Disclosure Review Board (DRB) approval number: CBDRB-FY20-115).
The Census Bureau has reviewed the weekly data by NAICS code product to ensure appropriate access, use, and disclosure avoidance protection of the confidential source data (Project No. P-7515311, Disclosure Review Board (DRB) approval number: CBDRB-FY26-0111).
The Census Bureau has reviewed the annual county level data product to ensure appropriate access, use, and disclosure avoidance protection of the confidential source data (Project No. P-7515311, Disclosure Review Board (DRB) approval number: CBDRB-FY25-0118).
The Census Bureau has reviewed the Annual Island Areas data product to ensure appropriate access, use, and disclosure avoidance protection of the confidential source data (Project No. P-7515311, Disclosure Review Board (DRB) approval number: CBDRB-FY26-0110).
