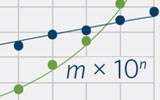
Calculating with Scientific Notation - Comparing Populations

Students will use population data from the U.S. Census Bureau to read and write numbers in scientific notation and to make comparisons of that data for states and decades. Students will also write ratios of the populations of their school’s state in different decades, determine if the ratios show a pattern, and make a scatter plot of the data.
Suggested Grade Level
8
Approximate Time Required
45-60 minutes
Learning Objectives
- Students will be able to perform operations with numbers, including decimals, expressed in scientific notation.
- Students will be able to use scientific notation to express ratios.
- Students will be able to create and interpret a scatter plot.
Materials Required
- The student version of this activity, 8 pages
- Graphing calculators
Activity Items
The following item is part of this activity. The item, its data source, and instructions for viewing the source data online appear at the end of this teacher version.
- Population of the Nation, All 50 States, the District of Columbia, and Puerto Rico: 1920–2020
Additional Information
Teacher Notes
Blooms Taxonomy
Applying


Students will apply their knowledge of scientific notation to analyze population data.
Subject
Middle School Math
Topics
- Scatter plots
- Scientific notation
Skills Taught
- Creating and interpreting a scatter plot
- Investigating patterns of association
- Reading, writing, and calculating with scientific notation
Page Last Revised - February 25, 2022


