Married Couple Households Made Up Most of Family Households
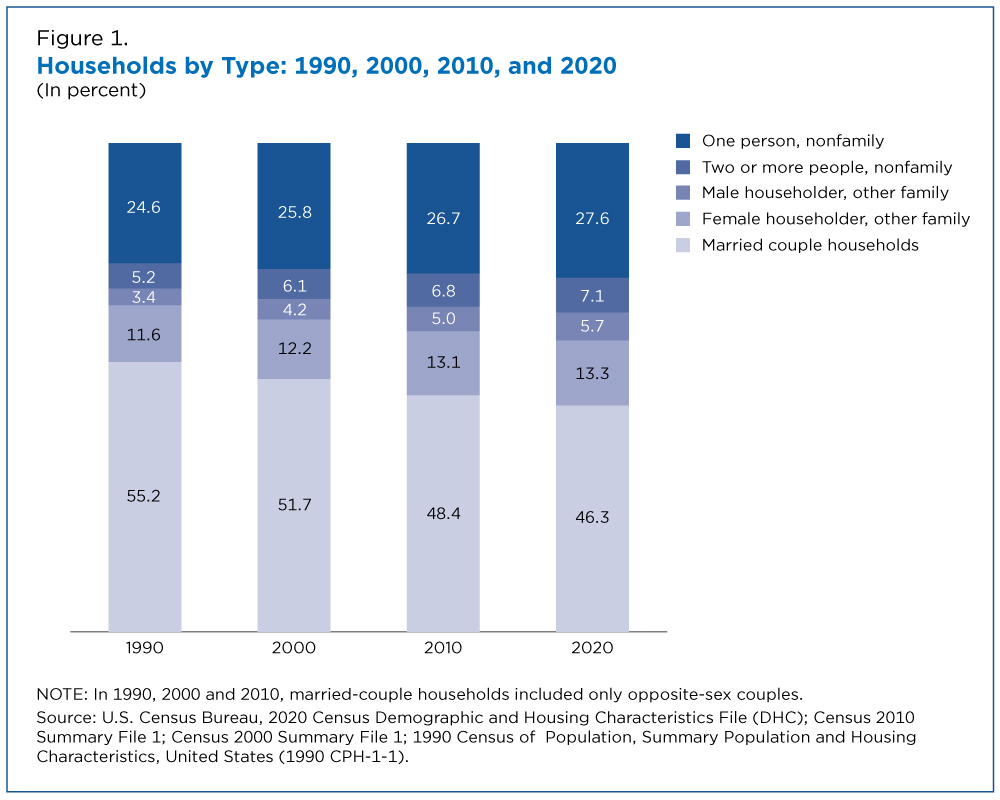
While one-person households increased from 25% in 1990 to 28% in 2020, family households remained the largest type of U.S. households and the majority were married-couple households, according to 2020 Census data released today.
About two-thirds of all U.S. households in 2020 were family households, the same share as a decade earlier; married-couple households accounted for about 71% of these households.
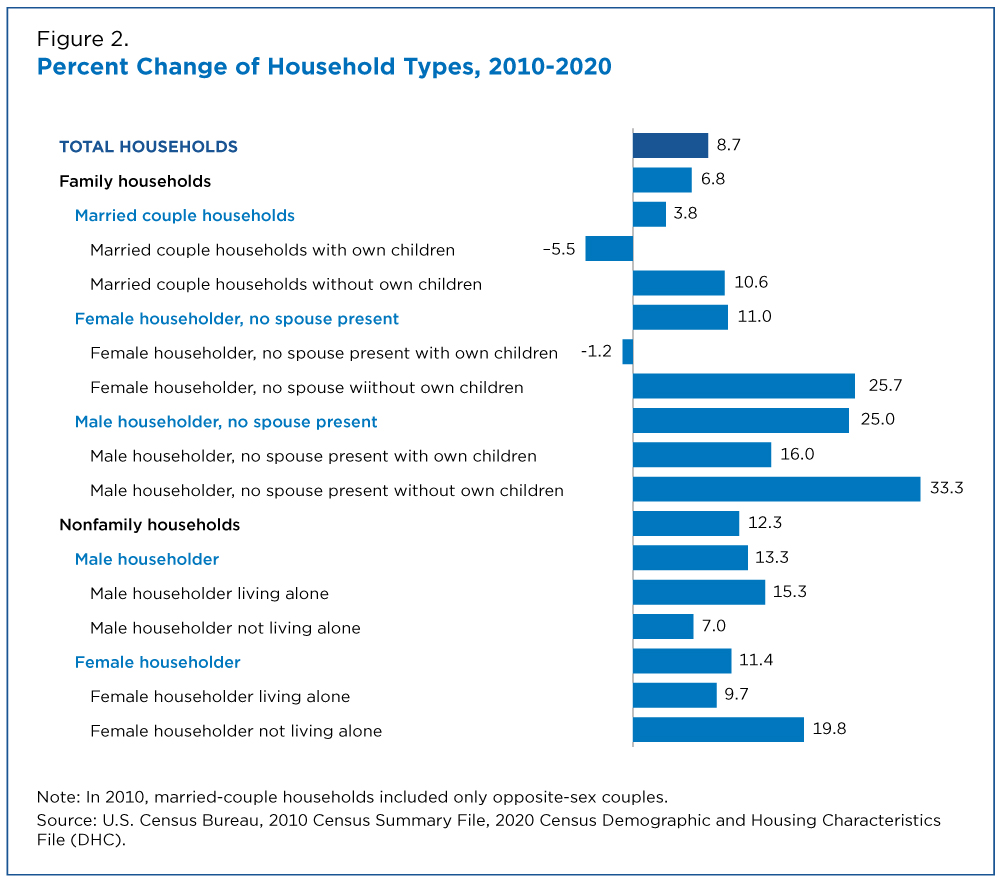
While married-couple households remained the majority of family households, those with their own children under 18 present decreased by 6%, reflecting the decade’s aging of the population as well as the increasing age at first birth.
In addition, for the first time in the decennial census, the 2020 Demographic and Housing Characteristics data released today show distinct totals for opposite-sex and same-sex spouse and unmarried partner households. In 2020, there were 1.2 million same-sex households in the United States.
How Did U.S. Households Change In Recent Decades?
Figure 1 takes a historical look at how some basic types of households shifted between 1990 and 2020. One-person households grew steadily and the share of nonfamily households (with two or more people) also increased (from 5% to 7%) during the three decades.
Among family households, the share with at least one other person related to the householder by birth, marriage or adoption increased, while the share of other types of family households decreased.
Married-couple households comprised 55% of all U.S. households in 1990, and 46% in 2020. At the same time, family households with a female householder grew from 12% to 13%, and those with a male householder from 3% to 6% of all households.
What Type of Households Increased?
According to the data, the number of U.S. households increased less from 2010 to 2020 (9%) than from 2000 to 2010 (11%).
The share of nonfamily households overall (those in which someone lives alone or no one related to the householder is present) increased more (12%) than family households (7%).
Figure 2 shows the biggest gainers among nonfamily households: male householders living alone and female householders who were not living alone.
However, family households still remained about two-thirds of all U.S. households as they did in 2010. While married-couple households remained the majority of family households, those with their own children under 18 present decreased by 6%, reflecting the decade’s aging of the population as well as the increasing age at first birth.
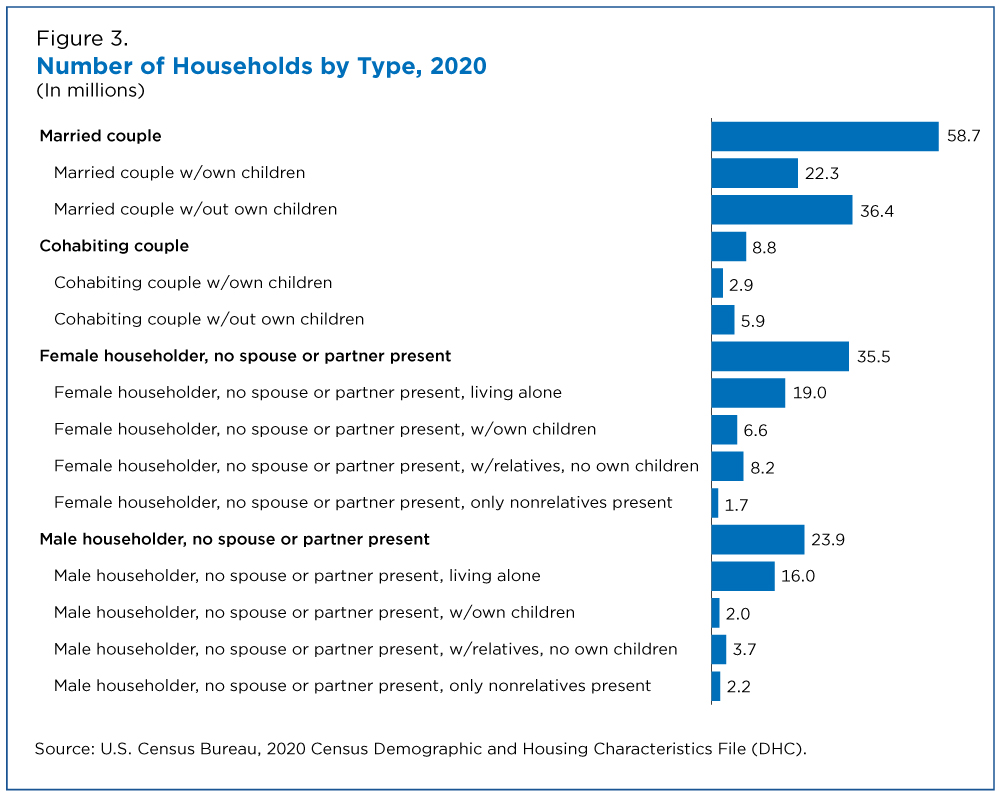
In 2020, there were roughly 127 million households and almost half were maintained by a married couple.
Married-couple households without their own children under 18 were more common than married- couple households with their own children. Of the 59 million married-couple households, about 36 million didn’t have kids living with them and 22 million did.
What About Cohabiting Couples?
Cohabitation has become more common especially among young adults. But cohabiting-couple households were still much less prevalent than married-couple households in 2020 (Figure 3).
Roughly 9 million U.S. households were maintained by a cohabiting couple. Most of these households did not have their own children under 18 residing with them, although roughly one quarter of births from 2017 to 2019 were to women who were cohabiting.
About 3 million households maintained by a cohabiting couple had children under 18 in the home, compared to about 6 million cohabiting-couple households with no children in the home.
How Are Household Members Related?
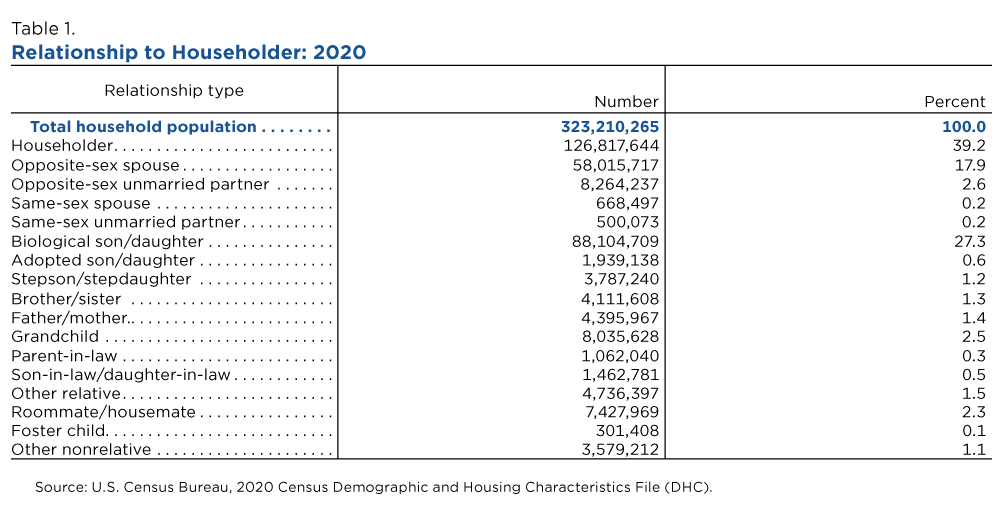
The majority of the 323.2 million people living in U.S. households in 2020 were either the householder, their spouse or partner or their children. These groups — 288.1 million people — made up 89% of the U.S. household population.
While there were significantly more opposite-sex spouses (58.0 million) than opposite-sex partners (8.3 million) in 2020, the gap was much narrower among same-sex couples: there were 668,497 same-sex spouses compared to 500,073 same-sex partners.
Children and Grandchildren
In 2020, 94% of the 93.8 million children of the householder were biological.
There were about twice as many stepchildren (3.8 million) as adopted children (1.9 million). Most — 61% — were under 18, with those ages 18-29 making up another 29% of all stepchildren of U.S. householders.
For all ages, grandchildren of the householder made up about 2.5% of the U.S. household population, comparable to 2010. However, the proportion of the population under 18 climbed from 7.9% in 2010 to 8.4% in 2020.
Related Statistics
Stats for Stories
Stats for Stories
Stats for Stories
Subscribe
Our email newsletter is sent out on the day we publish a story. Get an alert directly in your inbox to read, share and blog about our newest stories.
Contact our Public Information Office for media inquiries or interviews.


