Who’s Oldest or More Educated? Demographic and Socioeconomic Portrait of Race/Ethnic and Ancestry Groups
How does the Filipino population differ from the total Asian population in the United States? Which Asian group is the oldest or the largest? Is the Native Hawaiian population larger than all other Pacific Islander groups?
New American Community Survey (ACS) population tables released today contain the answers and a trove of other detailed data on hundreds of race, Hispanic origin, ancestry and tribal groups.
We release ACS characteristics for race and ethnic groups every year but the new 2017-2021 ACS Selected Population Tables (SPT) and American Indian and Alaska Native Tables (AIANT) is an even broader release that covers a 5-year period and offers social, economic, housing and demographic characteristics of more population groups at numerous geographic levels.
There are 399 population groups in the 2017-2021 SPT that had a national population estimate of at least 7,000 and 1,059 population groups in the 2017-2021 AIANT that had a national population estimate of at least 100. This is the third time the Census Bureau has released these detailed 5-year ACS estimates.
In this article, we present data on the detailed Asian and Native Hawaiian and Other Pacific Islander (NHPI) race alone and race alone or in any combination populations.
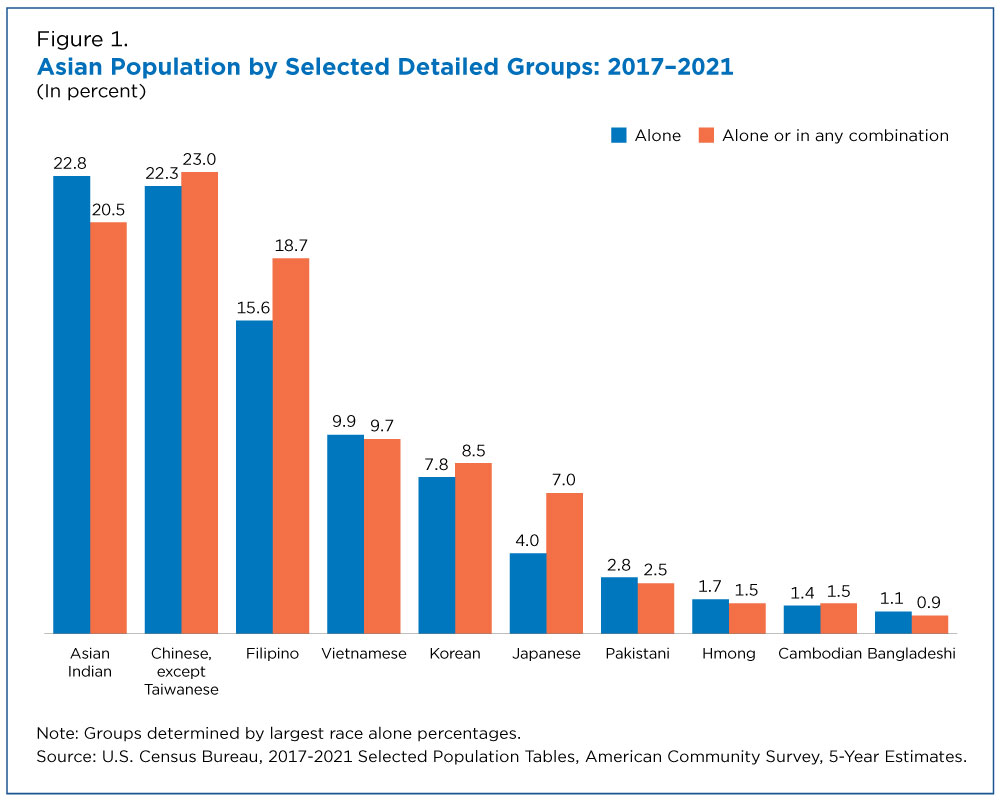
Among the Asian population, Asian Indian (22.8%) was the largest race alone group and Chinese, except Taiwanese the largest alone or in any combination group (23.0%).
The race alone population includes respondents who reported one detailed race response, such as Korean, and no other races. The race alone or in any combination population includes respondents who reported one response, such as Korean, and respondents who reported multiple races, such as Korean and Vietnamese or Korean and Black or African American.
As a result, the race alone or in any combination population represents the maximum number of people who identified as that detailed Asian or NHPI group.
These concepts are important to frame the discussion of racial and ethnic composition and help us understand the changing demographics of our country as it becomes much more multiracial.
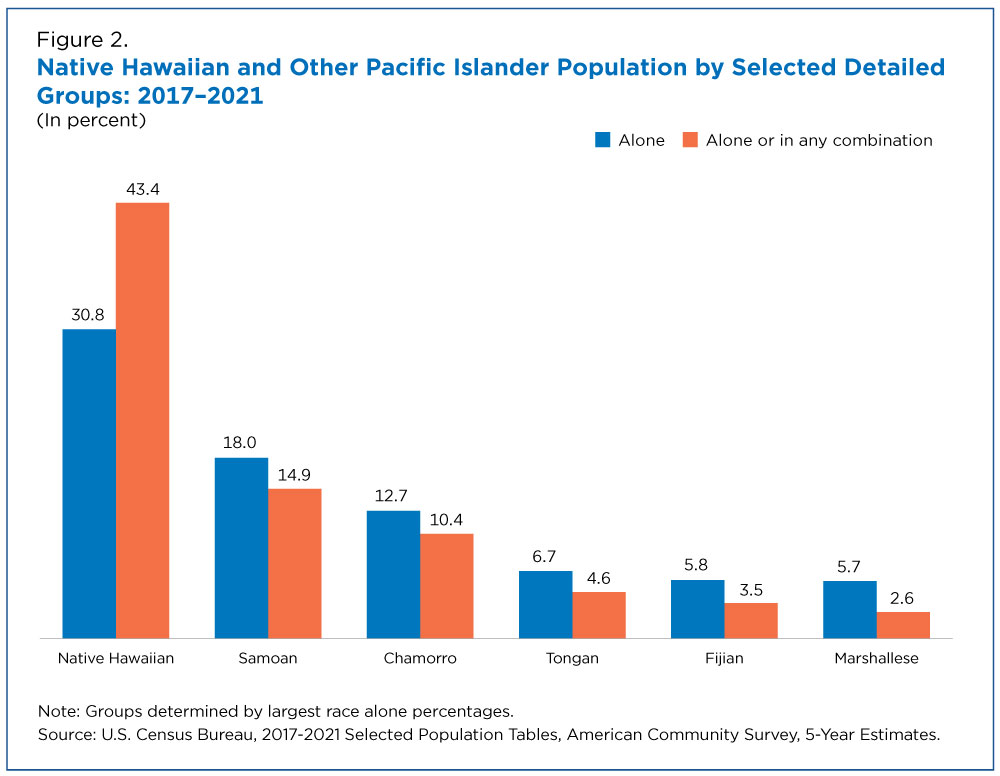
We highlight the 10 largest Asian and six largest NHPI population groups to illustrate the type of data available in these products. These groups were selected based on the race alone population size.
Asian Population
Among the Asian population, Asian Indian (22.8%) was the largest race alone group and Chinese, except Taiwanese the largest alone or in any combination group (23.0%).
The Filipino population and Japanese population had the largest percentage point difference (around 3%) between the alone and alone or in any combination groups.
Native Hawaiian and Other Pacific Islander (NHPI) Population
Among the NHPI alone population, Native Hawaiian was the largest detailed group for both alone and alone or in any combination — and had the largest percentage point difference (12.6%) between the alone and alone or in any combination groups.
Although more people are reporting multiple race groups in the nation, five of the six detailed NHPI groups had smaller percentages of the race alone or in any combination populations than the race alone population.
Median Age
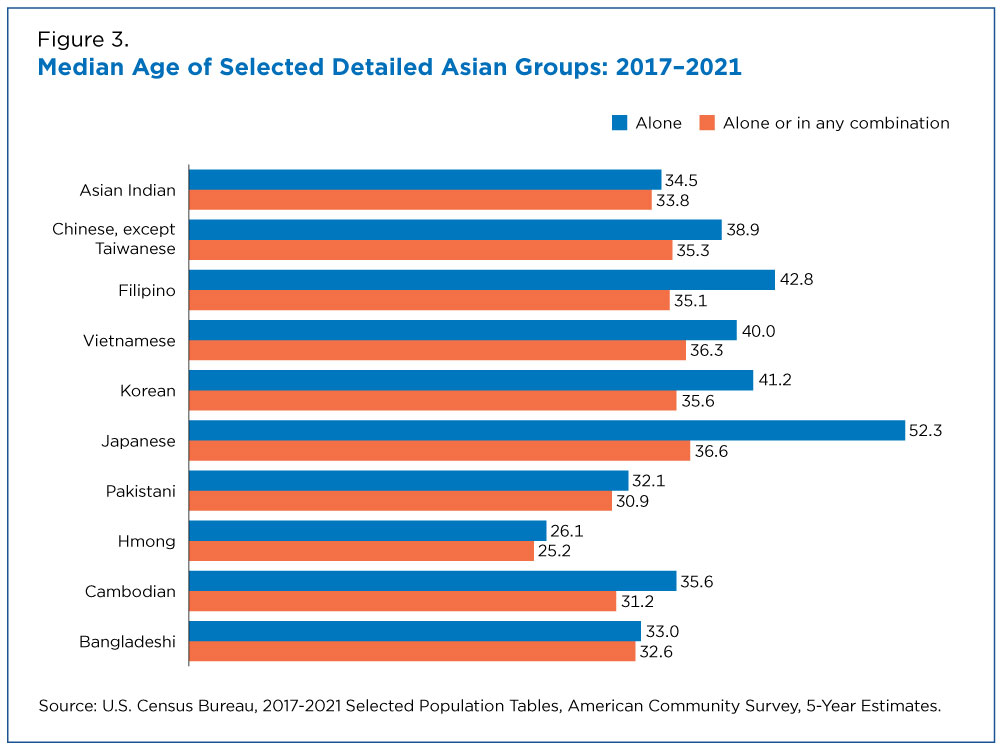
The race alone population for each detailed Asian group was older than the alone or in any combination population. The only exception is the Bangladeshi alone population, which is not statistically different when compared to the Bangladeshi alone or in any combination population.
The Japanese alone population was the oldest, with a median age of 52.3, followed by Filipino alone (42.8); Korean alone (41.2); Vietnamese alone (40.0); and Chinese, except Taiwanese alone (38.9).
The Hmong population had the youngest median age for both the alone (26.1) and alone or in any combination (25.2) populations.
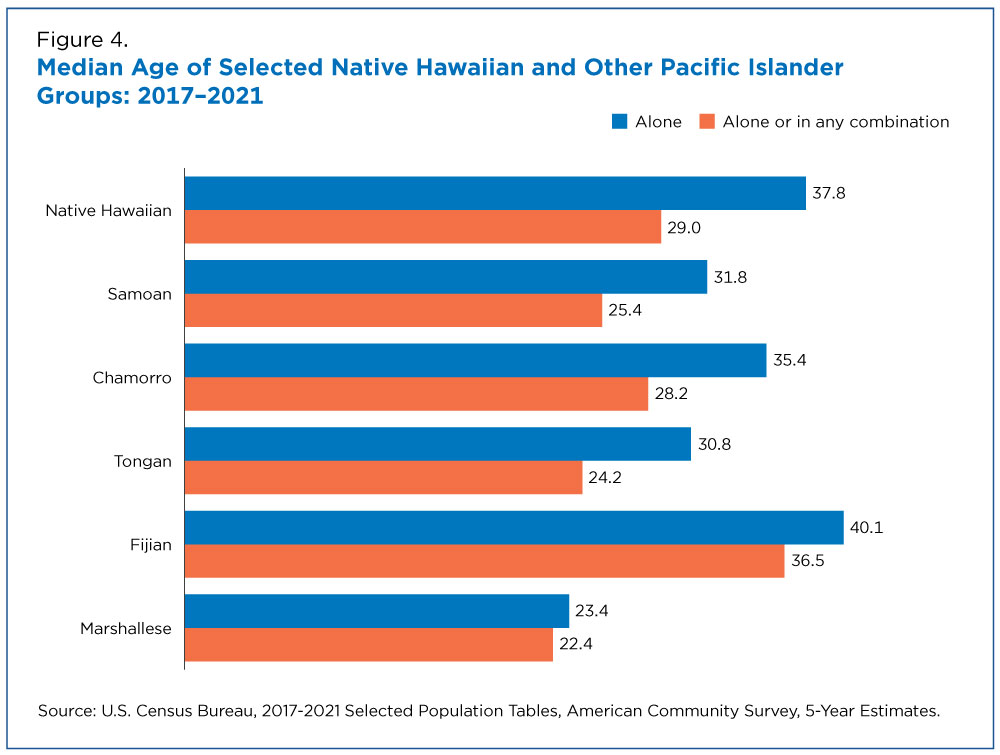
Similar to the Asian groups in Figure 3, almost all of the NHPI alone groups were older than the alone or in any combination groups. The only exception is the Marshallese population, whose median age is not statistically different when comparing its alone population to the alone or in any combination population.
The Fijian alone population was the oldest, with a median age of 40.1, followed by Native Hawaiian alone (37.8) and Chamorro alone (35.4).
The Marshallese population had the youngest median age (22.4) for the alone or in any combination population.
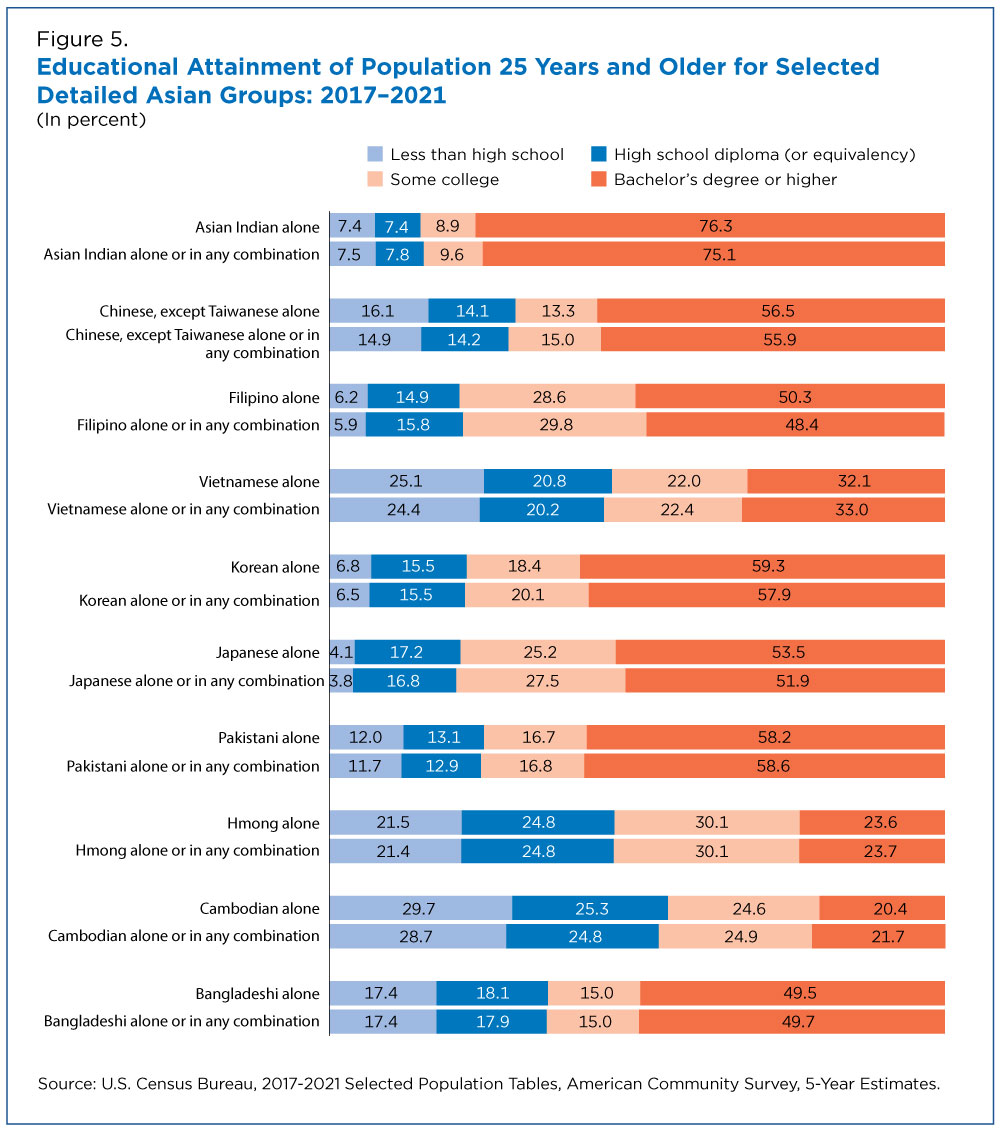
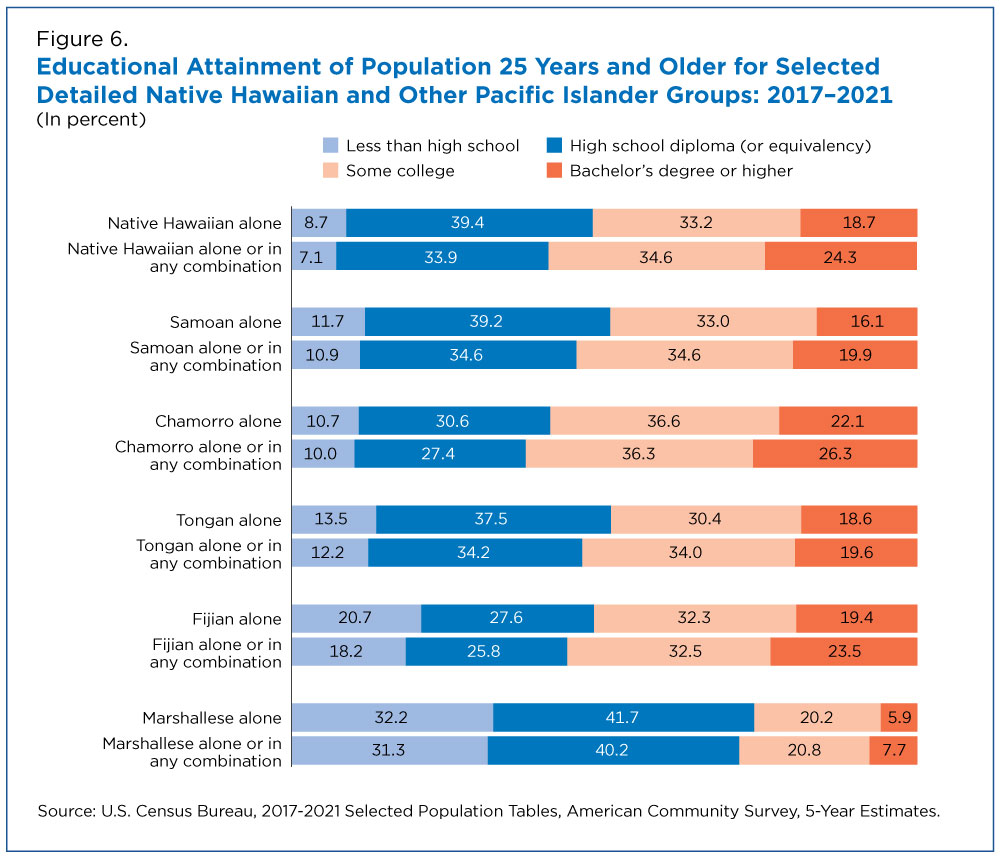
Educational Attainment
Asian alone groups showed similar patterns for educational attainment compared to their alone or in any combination group counterparts.
The Japanese alone or in any combination population with some college was 2.3 percentage points higher than the Japanese alone population — the largest difference among Asian groups.
Over three-quarters of the Asian Indian and over half of the Korean, Pakistani, Chinese except Taiwanese, and Japanese populations had a bachelor’s degree or higher.
The Cambodian, Vietnamese and Hmong alone and alone or in any combination populations had the largest shares of high school diploma (or equivalency) attainment only.
The Native Hawaiian alone or in any combination population with a bachelor’s degree or higher was 5.6 percentage points higher than the Native Hawaiian alone — the largest difference between an alone and alone or in any combination group.
Among those with a bachelor’s degree or higher, Chamorro alone or in any combination had the largest percent (26.3%), followed by both Native Hawaiian alone or in any combination (24.3%) and Fijian alone or in any combination (23.5%).
At least 58% of the NHPI alone and alone or in any combination populations had either a high school diploma (or equivalency) attainment or some college.
The Marshallese and Fijian alone and alone or in any combination populations had the largest percentages of people who did not graduate high school.
About the ACS SPT/AIANT
More information about the available tables, geographies, population groups, comparison guidance, and accuracy of tables for the SPT and AIANT can be found on the Race, Ethnicity, Ancestry and American Indian & Alaska Native Tables webpage.
Statistics are published for an individual group in a particular geographic area if it had at least 50 people that completed the 2017-2021 survey.
Among groups in the SPT: Bhutanese, Fijian, Paraguayan, Algerian, Cherokee tribal grouping, and Yup’ik tribal grouping.
Among groups in the AIANT: Seminole Tribe of Florida, Blackfeet Tribe of the Blackfeet Indian Reservation of Montana, Native Village of Noatak and Native Village of Napakiak.
Related Statistics
Facts for Features & Special Editions
Visualization
Press Release
Subscribe
Our email newsletter is sent out on the day we publish a story. Get an alert directly in your inbox to read, share and blog about our newest stories.
Contact our Public Information Office for media inquiries or interviews.


