
Official websites use .gov
A .gov website belongs to an official government organization in the United States.
Secure .gov websites use HTTPS
A lock (
) or https:// means you’ve safely connected to the .gov website. Share sensitive information only on official, secure websites.

Topics
Data & Maps
Surveys & Programs
Resource Library
About 70 Percent of Homes in Miami and Tampa Have an Emergency Kit; Rates Vary by Metro Area

For Immediate Release: Tuesday, March 31, 2015
About 70 Percent of Homes in Miami and Tampa Have an Emergency Kit; Rates Vary by Metro Area
Press Release Number CB15-61

New American Housing Survey Statistics Reveal Snapshot of U.S. Homes
More than half, 51.5 percent, of U.S. homes have a prepared emergency evacuation kit, according to new metropolitan area-level American Housing Survey statistics released jointly today by the U.S. Department of Housing and Urban Development and the U.S. Census Bureau.
The level of preparedness varies by metro area, with about 70 percent of households in the Miami and Tampa, Fla., metro areas having emergency supplies readily available in the event of an evacuation. The Austin (Texas), Chicago and Minneapolis metro areas had among the lowest rate of homes with an emergency preparedness kit.
These statistics come from new disaster preparedness questions, one of four topics added to the 2013 American Housing Survey. The three other topics are community involvement, neighborhood characteristics and public transportation. The disaster preparedness questions examine, for example, how many households are prepared for emergency situations such as fire, terrorist attack or large-scale natural disaster.
“The American Housing Survey added questions on emergency preparedness in response to recent natural disasters, such as Hurricane Katrina and Hurricane Sandy,” said Kurt G. Usowski, Deputy Assistant Secretary for Economic Affairs at HUD. “Emergency responders at all levels of government along with policymakers and businesses can use the American Housing Survey for planning and decision-making.”
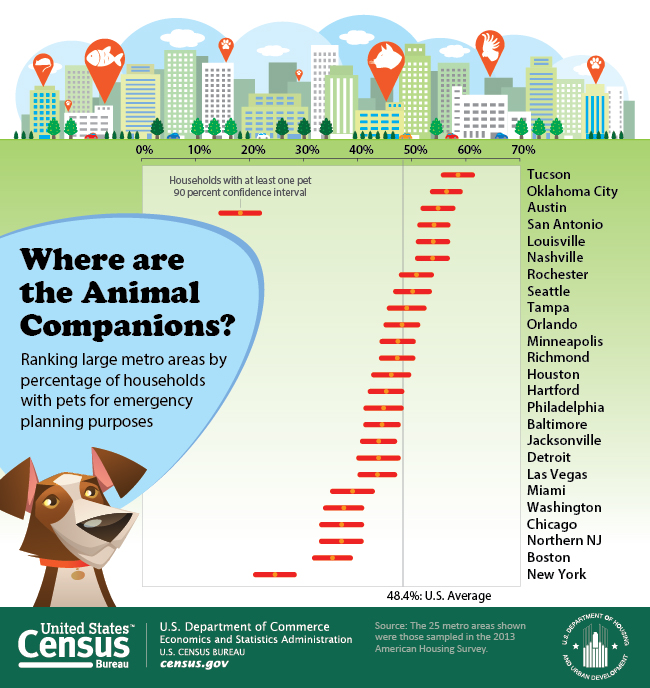
These new questions will help policymakers determine if households in the United States have a critical plan in place for all members of their homes, including their pets. Some of the survey’s new questions found that nationally 48.4 percent of homes have a pet, 54.3 percent have an emergency water supply, and 18.3 percent of single-family homes (excluding manufactured/mobile homes) have a generator.
“Our goal is to prepare communities for the risks posed by extreme weather and other natural disasters and strengthen communities’ ability to be economically and culturally resilient in the face of a changing climate and natural disasters,” Usowski said.
In addition to the new questions, the American Housing Survey continues to include valuable economic indicators, such as the number of underwater mortgages (owing more than the value of the home) in major cities and median monthly property insurance costs. There is vast regional variation among the metro areas sampled in the 2013 American Housing Survey in the underwater mortgages measure, with high percentages in Detroit and selected Sun Belt areas (Las Vegas; Tucson, Ariz.; and Tampa, Miami and Orlando, Fla.) and comparatively low rates in the Texas and Oklahoma metros.
The American Housing Survey is the most comprehensive housing survey in the United States. Every odd-numbered year, data are collected to provide national and selected metropolitan area statistics. The 2013 survey results released today list statistics for 25 metropolitan areas.
New from the American Housing Survey
Added to the 2013 survey were questions about disaster preparedness, community involvement, neighborhood characteristics and public transportation. Below are highlights from some of the findings from the 25 metropolitan areas surveyed:
- The Austin, Chicago, Minneapolis, Tucson, Boston, Rochester (N.Y.), and Nashville (Tenn.) metro areas had among the lowest rate of homes with an emergency preparedness kit.
- Austin, Louisville (Ky.), Nashville, Oklahoma City, San Antonio and Tucson were among the highest metro areas with pets in the home with over 53 percent of homes owning at least one pet. The New York City metro area had the lowest at around 25 percent of homes with a pet.
- Nationally, 27.8 percent of households volunteered in their community. The Minneapolis, Louisville, Hartford (Conn.), Boston and Seattle metro areas had some of the highest rates of volunteerism with over 34 percent of households providing free work in their communities.
- 78.7 percent of U.S. households agreed that their neighbors could be trusted. Minneapolis, Nashville and Richmond (Va.) metro areas had among the highest rates of households who felt their neighbors were trustworthy. Some of the lowest rates came from Las Vegas, Orlando and New York City.
- 14.3 percent of U.S. households lived in neighborhoods with bike lanes, while 45.3 percent had adequately lit sidewalks. The New York City metro area had the highest rate of adequately lit sidewalks at 75.8 percent. The lowest rates were in Nashville, Oklahoma City, Richmond and Tucson.
Standard Results from the American Housing Survey
In addition to the new survey topics, the American Housing Survey covers topics such as physical housing characteristics and financial characteristics that can be tracked historically. Below are highlights from the national and metropolitan statistical area level findings:
- Median monthly property insurance for owners was highest in the Miami metro area at $167 per month. Homeowners in Rochester, Tucson and Las Vegas had among the lowest median monthly property insurance payments, ranging from $42 to $45.
- Nationally, 11.1 percent of homeowners considered themselves to be underwater on their mortgages because they had a reported mortgage balance greater than their opinion of their home’s value. Detroit, Las Vegas, Orlando, Tampa, Miami and Tucson reported some of the highest rates of underwater mortgages, with at least 19 percent of households owing more on their mortgages than their homes are thought to be worth.
- Nationally, median monthly real estate taxes were $150. The Northern New Jersey metro area had the highest median monthly real estate taxes at $643. Some of the lowest taxes were found in Louisville, Oklahoma City, Tampa, Las Vegas, Nashville and Jacksonville (Fla.), which ranged from $100 to $111 per month.
- The majority of metro areas sampled had less than 10 percent of households reporting their drinking water to be unsafe. The highest reported rate came from Las Vegas, with 24.6 percent of households considering their water to be unsafe.
-X-
Note: Statistics from sample surveys are subject to sampling and nonsampling error. All comparisons made in this release have been tested and found to be statistically significant at the 90 percent confidence level. For more on errors and constructing confidence intervals, go to Appendix D //www2.census.gov/programs-surveys/ahs/2013/National%20Appendix%20D%202013.pdf.
Contact
Virginia Hyer
Public Information Office
301-763-3030
email: <pio@census.gov>

Page Last Revised - February 28, 2023
✕
Is this page helpful?
 Yes
Yes
 No
No
 Yes
Yes
 No
No✕
NO THANKS
255 characters maximum
 255 characters maximum reached
✕
Thank you for your feedback.
Comments or suggestions?

Comments or suggestions?