An official website of the United States government
Here’s how you know
Official websites use .gov
A .gov website belongs to an official government organization in the United States.
Secure .gov websites use HTTPS
A lock (
) or https:// means you’ve safely connected to the .gov website. Share sensitive information only on official, secure websites.
-
//
- Census.gov /
- Random Samplings /
- Families: A Changing Nation
Families: A Changing Nation
Families: A Changing Nation
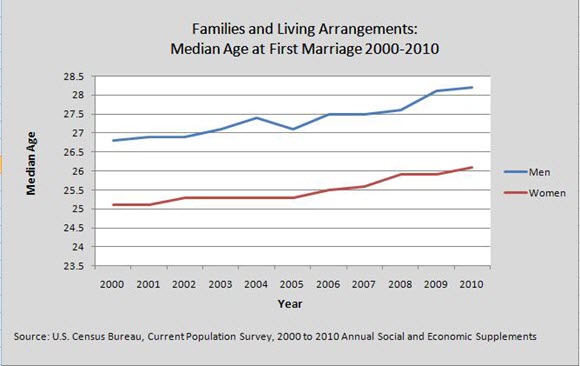
Today we released America’s Families and Living Arrangements: 2010, which shows socioeconomic characteristics of our nation — average household size, median age at first marriage and overall percentage of adults that are married, just to name a few. The data show continuations of long-term patterns over the last decade, such as the increase in median age at first marriage.
Year to year these changes may seem insignificant, but if you look at our historical tables you can see how the nation has evolved. In 1960, the average household size was 3.33, and men and women married in their early 20s. Only 6 million children lived with one parent (according to 1960 Census data) and 7 million people lived alone.
Related Information
Share
 Yes
Yes
 No
NoComments or suggestions?


Top

