Using Census Bureau Data Made Easier: New Statistical Testing Tool Answers the Question Is This Comparison Statistically Significant?
Using Census Bureau Data Made Easier: New Statistical Testing Tool Answers the Question Is This Comparison Statistically Significant?
American Community Survey data can help you find quick answers on a variety of demographic and economic topics. For example, you might need to know “What’s the unemployment rate where I live?” A natural follow-up question might be “How does my town compare to a neighboring one?”
If you are using survey data to compare estimates, you must perform a statistical test to answer this type of question correctly. While it is easy to compare two estimates, survey data are based on a sample of the population — not the entire population — so it has statistical uncertainty. In the case of American Community Survey data, the margin of error is one type of statistical uncertainty. If the uncertainty is too large, then two estimates may appear different, but may not actually be statistically different. In that case, claiming there is a difference between them would not be accurate.
With the release of the U.S. Census Bureau’s new statistical testing spreadsheet tool, we are making it easier for just about anyone to carry out statistical testing correctly. The tool handles the testing behind the scenes for you. American Community Survey data may be downloaded or copied directly from the Census Bureau’s website. No special reformatting is necessary.
Data from the American Community Survey
Let’s say you want to compare the data for households without a computer in the three counties (see Figure 1). The data are from the newly released 2014 American Community Survey 1-Year Supplemental Estimates. The three counties were chosen because their populations were all roughly the same (about 20,000 people).
Statistical Testing for Two Estimates
To compare one estimate to another, copy the estimates and their margins of error from the table on the Census Bureau’s website and paste them into the spreadsheet. The result of the statistical test will appear on the right as a “Yes” or “No.” Figure 2 gives an example of the test in action. The example gives three different instances comparing one city to another at a time.
Note that you do not need to remove the “+/-” that precedes the margin of error in published American Community Survey products. The tool handles this and other special characters. In addition, the tool supports up to 3,230 possible comparisons of two estimates simultaneously. Thus, you may use it to test a large number of estimates at the same time. For example, you may test change over time for every county in the United States by comparing two sets of estimates for the same characteristic published a year apart.
While Saluda County, S.C., appears to have the highest number of households without computers, looking at the testing results (the red “No”), we see that it is not statistically different from Scott County, Ind. However, it is statistically different from New Kent County, Va. (the “Yes”), as seen in the second comparison.
Statistical Testing for Multiple Estimates
Additionally, the tool allows you to easily compare multiple estimates. This comes in handy when you want to test multiple geographies with each other simultaneously. Due to the large number of calculations done behind the scenes, the tool can compare up to 150 estimates. This keeps the display manageable in size while providing fast results. If you have between 10 and 150 estimates, using this method would require less cutting and pasting to achieve the same results.
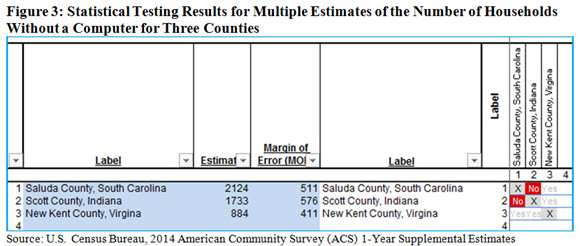
In figure 3, we see the same results as in the previous example in a different format. Again, the results are shown as “Yes” and “No.” In addition, estimates compared to themselves have an “X” in the results.
Although it was designed with the American Community Survey in mind, other Census Bureau survey data may be used with the statistical testing spreadsheet tool. The tool is designed to be intuitive to use. It provides data users with an easy method to conduct statistical testing and assumes independence between estimates.


