An official website of the United States government
Here’s how you know
Official websites use .gov
A .gov website belongs to an official government organization in the United States.
Secure .gov websites use HTTPS
A lock (
) or https:// means you’ve safely connected to the .gov website. Share sensitive information only on official, secure websites.
-
//
- Census.gov /
- Random Samplings /
- How Maps Bring Census Statistics to Life for Students, Wherever They Are
How Maps Bring Census Statistics to Life for Students, Wherever They Are
How Maps Bring Census Statistics to Life for Students, Wherever They Are
Does a state have few or many people for its size? What does diversity of the country mean?
What is everyone’s place in the American tapestry?
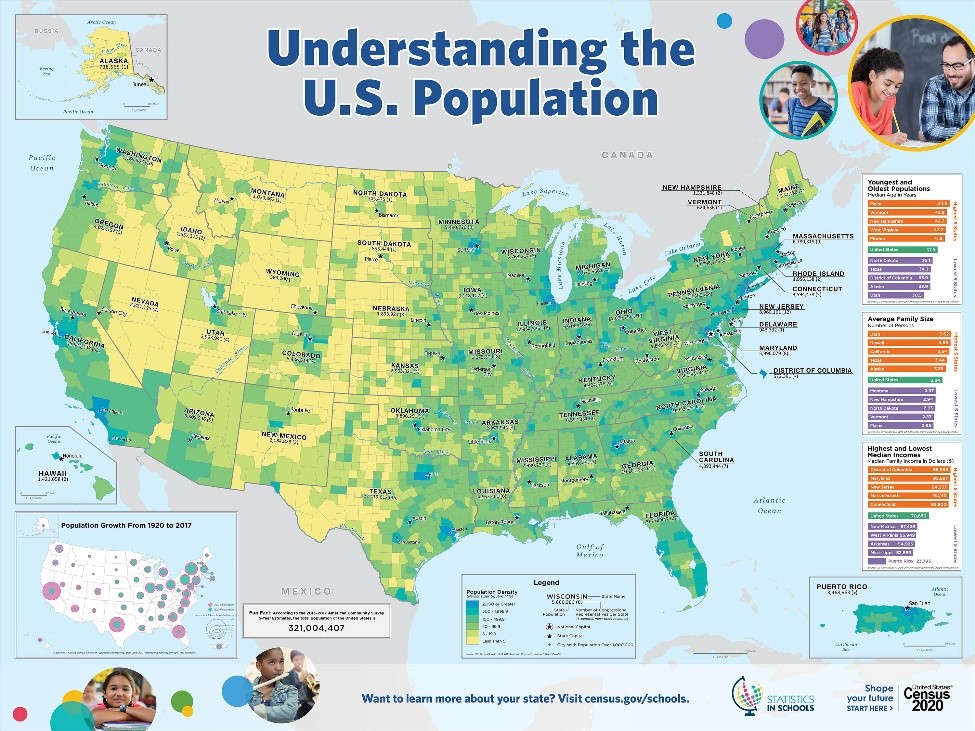
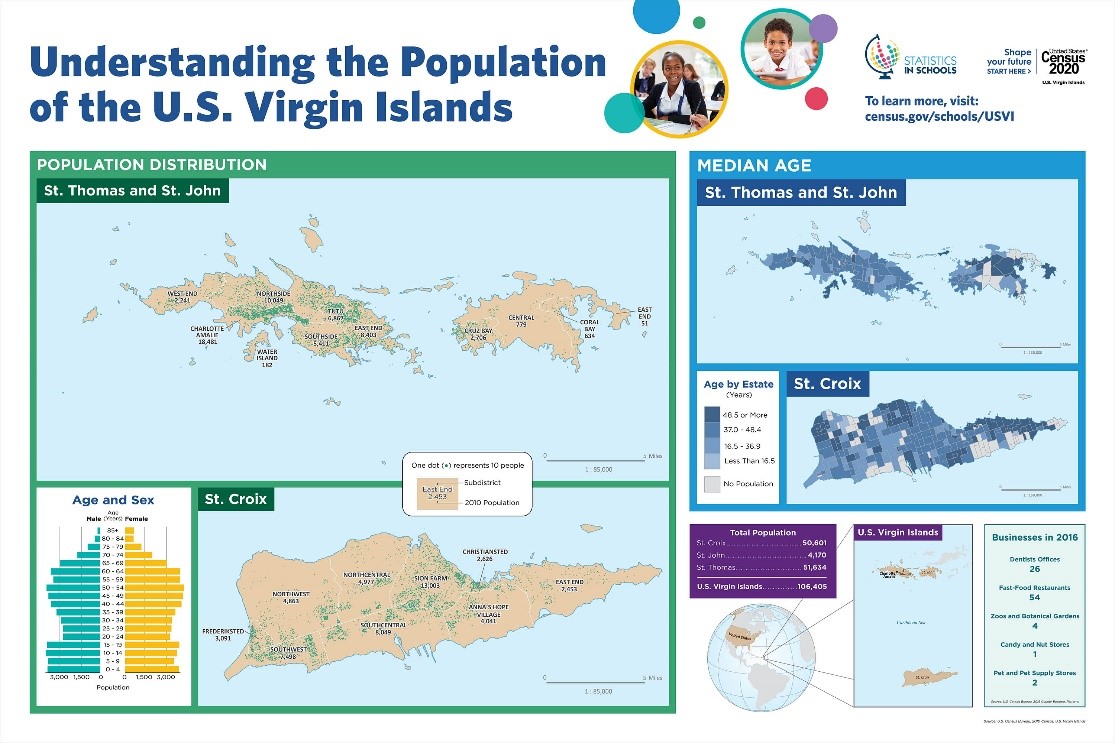
The U.S. Census Bureau’s Statistics in Schools (SIS) program helps students in classrooms across the country answer these questions by providing colorful maps for the 2019-2020 school year filled with census-based facts about the United States and its territories. There are maps aimed at elementary, middle and high school grade levels.
Teachers use these maps to underscore the importance of responding to the 2020 Census and to prompt their students to answer interactive questions based on the statistics. Now, with schools closed and e-learning the new normal, teachers can link to SIS maps online to use and share with students at home.
Facts on these engaging maps can inspire learning in the home. For example, numbers and visuals on them show:
1. Where people live – with population, population density and population growth comparisons by state.
2. The nation’s diversity in terms of race, ethnicity, nationality, age group, sex, level of education, and languages spoken at home.
3. States with the youngest and oldest populations, largest and smallest average family size, and highest and lowest median incomes.
4. Population characteristics and trends in Puerto Rico, American Samoa, Guam, the Northern Mariana Islands, and the U.S. Virgin Islands.
The Census Bureau, which has been producing these kinds of maps since 1854, is considered an innovator and leader in cartography (the science and practice of creating maps).
The Geography Division at the Census Bureau creates maps to support field representatives in collecting data, for example, pinpointing the location of traditionally hard-to-count areas for 2020 Census planners. Maps also show and distill the vast quantity of statistical data collected by the Census Bureau, making it easier for policymakers, business leaders, policy analysts and others to use.
“The work that the Geography Division does can provide meaning and context to the statistics that the Census Bureau produces,” notes Kevin Hawley, chief of the Census Bureau’s Cartographic Products and Services Branch. Hawley and other Census Bureau cartographers are featured in a virtual field trip to the U.S. Census Bureau — a video tour that takes students on a quest to learn more about how census data are collected, processed and used.
Maps and other visuals for teachers and students are always available at no charge online through the Statistics in Schools program. They include the popular and interactive State Facts for Students, which teachers can encourage students to explore on their own or with other people in their home. Help your students get started by sharing our 2020 maps with them today!
Share
 Yes
Yes
 No
NoComments or suggestions?


Top


