
Official websites use .gov
A .gov website belongs to an official government organization in the United States.
Secure .gov websites use HTTPS
A lock (
) or https:// means you’ve safely connected to the .gov website. Share sensitive information only on official, secure websites.

Topics
Data & Maps
Surveys & Programs
Resource Library

New Infographic Shows Total Value of Manufacturing Shipments for 2019 and 2018
The U.S. Census Bureau has just released its annual survey that provides the most detailed statistics on the U.S. manufacturing sector.
The Annual Survey of Manufactures (ASM) shows statistics at the 2-6 digit North American Industry Classification System (NAICS) nationally, while the Geographic Area Series (GAS) shows 2-4 digit NAICS at the state and national levels.
The survey includes manufacturing establishments with one or more paid employees, including establishments with leased employees.
The ASM is not collected in Economic Census years — years ending in ‘2’ and ‘7.’ The ASM published last month was for survey year 2019.
Also available: an infographic of 2019 and 2018 ASM data that outlines the U.S. manufacturing sector’s total value of shipments.
The 2019 ASM “Statistics for Industry Groups and Industries” table provides data on:
- Employment.
- Payroll.
- Cost of materials consumed.
- Operating expenses.
- Value of shipments.
- Value added by manufacturing.
- Fuels and electric energy used.
- Inventories.
Additionally, the ASM provides the most detailed measure of U.S. manufacturing industry outputs and inputs.
The survey includes manufacturing establishments with one or more paid employees, including establishments with leased employees.
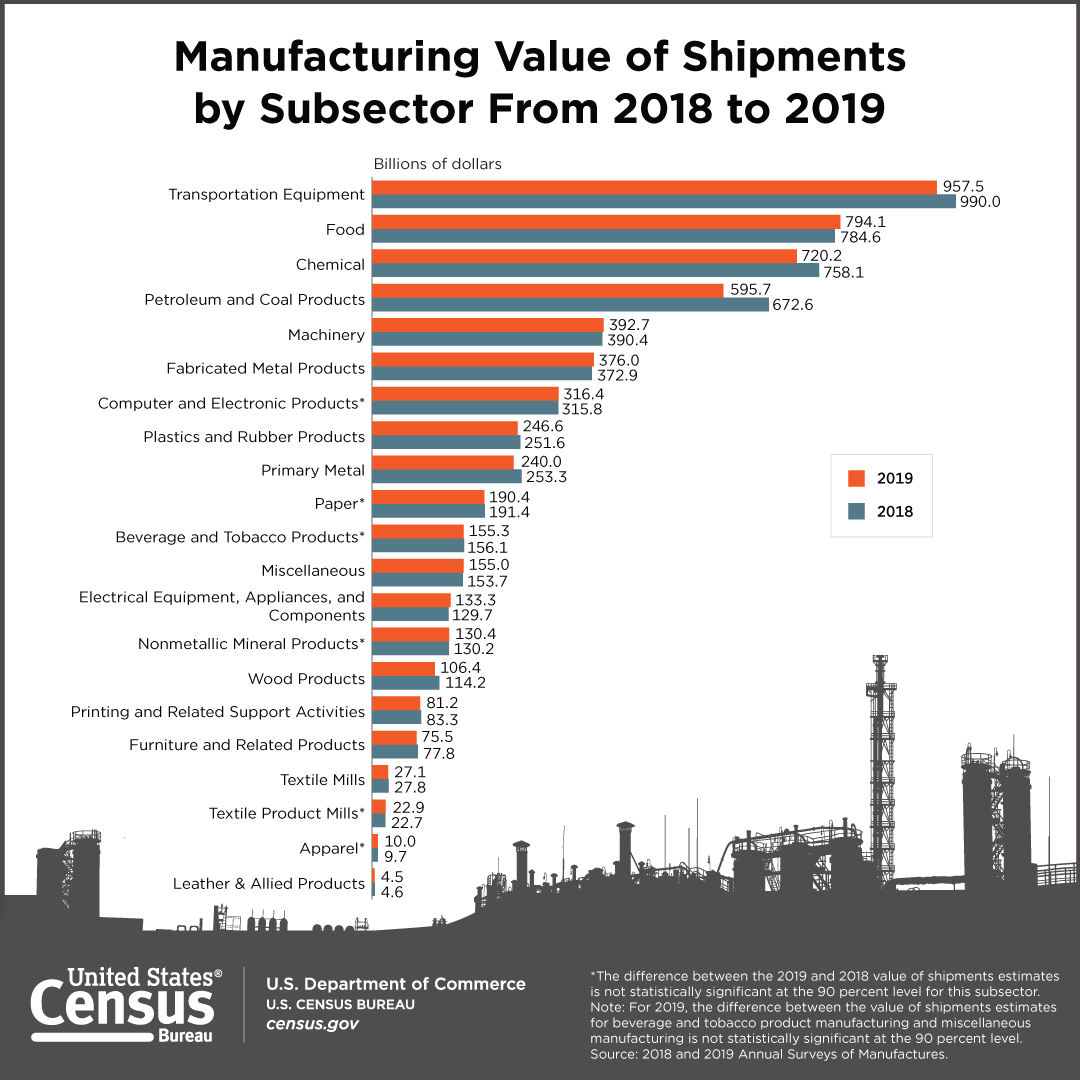
The infographic above shows the leading manufacturing subsectors by 2019 total value of shipments. It also compares the total value of shipments for each subsector between the 2019 and 2018 survey years.
For example, Transportation Equipment Manufacturing was still the leading manufacturing subsector in both 2019 ($957.5 billion) and 2018 ($990.0 billion) in total value of shipments. The next two leading subsectors in 2019 were Food Manufacturing with total value of shipments of $794.1 billion, and Chemical Manufacturing with $720.2 billion.
The Geographic Area Statistics for the 2019 ASM shows, for example, that Texas was the leading manufacturer in the United States with a total value of shipments of $599.8 billion.
The Bureau of Economic Analysis (BEA), the Bureau of Labor Statistics (BLS) and Federal Reserve Board (FRB) are among key users of ASM results.
The BEA uses the published data to produce its estimates on the gross domestic product (GDP). The BLS uses the info to calculate annual productivity series and update producer price indexes. And the FRB uses ASM data points to prepare the Index of Industrial Production.
Adam Grundy is a supervisory statistician in the Economic Management Division at the Census Bureau.

This article was filed under:
America Counts Story
Manufacturing Still Among Top Five U.S. Employers
Held annually on the first Friday in October, Manufacturing Day showcases the contributions of a key economic sector.
America Counts Story
Manufacturing Faces a Labor Shortage as Workforce Ages
Nearly one-fourth of the manufacturing workforce is age 55 or older and retaining and attracting workers is a challenge.
America Counts Story
Manufacturing Day: Recognizing the Sector’s Impact on the U.S. Economy
Census Bureau shares a wealth of manufacturing data to celebrate the contributions of this vital economic sector on Manufacturing Day this Friday.
Page Last Revised - December 16, 2021
✕
Is this page helpful?
 Yes
Yes
 No
No
 Yes
Yes
 No
No✕
NO THANKS
255 characters maximum
 255 characters maximum reached
✕
Thank you for your feedback.
Comments or suggestions?

Comments or suggestions?