
Official websites use .gov
A .gov website belongs to an official government organization in the United States.
Secure .gov websites use HTTPS
A lock (
) or https:// means you’ve safely connected to the .gov website. Share sensitive information only on official, secure websites.

Topics
Data & Maps
Surveys & Programs
Resource Library
Business Dynamics Statistics of Single Unit Firms with Revenue (BDS-SU-REV)
Business Dynamics Statistics of Single Unit Firms with Revenue (BDS-SU-REV)

The Business Dynamics Statistics of Single Unit Firms with Revenue (BDS-SU-REV) is an experimental data product extending the set of statistics published by the Business Dynamics Statistics (BDS) program. The BDS-SU-REV provides year-over-year changes in employment, payroll, and revenue for each quarter of the year for businesses that operate in one location (single-units) and file their taxes under a single Employer Identification Number (EIN). This product relies on IRS annual tax filing to collect revenue information and IRS quarterly tax filings to collect employment and payroll information for the pay periods including March 12th, June 12th, September 12th, and December 12th. Year-over-year employment and payroll changes are calculated between the same point in year t and year t-1 (i.e., June 12th year t-1 to June 12th year t, etc.). Employment and payroll growth is labeled as job and pay creation respectively and employment and payroll decline as job and pay destruction.
A novel innovation in the BDS-SU-REV is the incorporation of annual revenue data for single-establishment firms that consistently maintain positive employment levels each quarter. A positive annual growth in revenue is categorized as revenue creation, while negative growth is categorized as revenue destruction.
Revenue Data Insights
The BDS-SU-REV data reveals that the COVID-19 pandemic had a significant impact on the net real revenue creation rate for single-unit firms. In Figure 1, we observe that in 2019 the average net real revenue creation rate was 8%. However, this rate plummeted to less than 2% in 2020. By 2021, this rate recovered and it is approaching its pre-pandemic level of 8%. To construct real revenue measures, we use the Bureau of Economic Analysis (BEA) GDP implicit price deflator, with a base year of 2012.
Figure 1. Annual net real revenue creation rate for all firms active in quarter 4
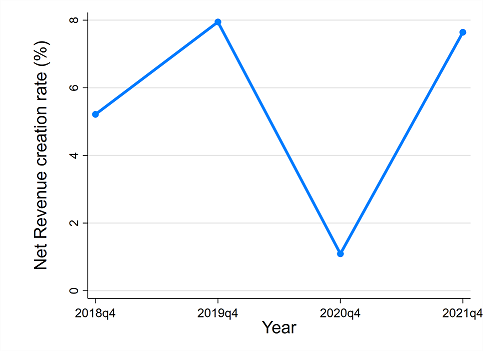
Source: BDS-SU-REV public tables. Net revenue creation rate = revenue creation rate – revenue destruction rate.
The drop in the net revenue creation rate in 2020 seen above, was primarily caused by a significant rise in the revenue destruction rate across all firms, including both active and exited firms. Remarkably, the revenue destruction rate for firms that exited by 2020-Q4 remained relatively constant, as seen in Figure 2.
Figure 2. Annual real revenue destruction rate for all firms active in quarter 4
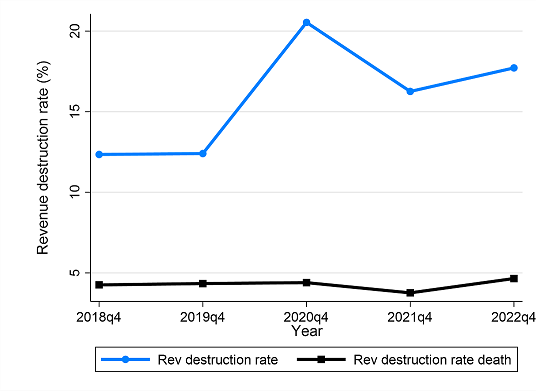
Source: BDS-SU-REV public tables.
Figure 3 illustrates the net revenue creation rate by state for 2019 and 2020. In 2019, California, New York, and Texas had net revenue creation rates above 5%, reaching 11%, 17%, and 5%, respectively. However, by 2020, these states experienced negative net revenue creation rates of -2%, -17%, and -1%.
Figure 3. Net real revenue creation rate (%) by State for firms active in quarter 4
Year = 2019
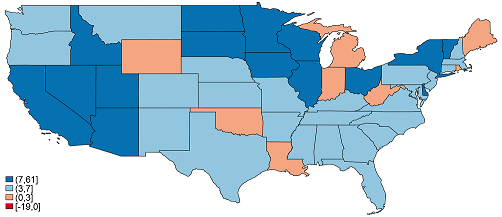
Year = 2020
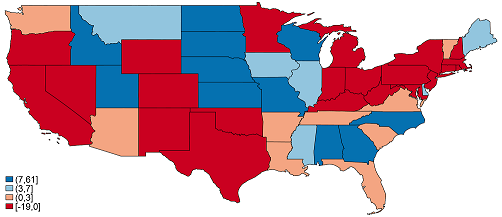
Source: BDS-SU-REV public tables.
In terms of revenue levels for single-unit firms, we can observe from Figure 4 that the Real revenue has been on a steady rise from 9.5 trillion in 2018-Q4 to 10.5 trillion in 2021-Q4, except in the pandemic year 2020, where it remained stable from is previous year level.
Figure 4. Annual real revenue ($ Billion) for all firms active in quarter 4
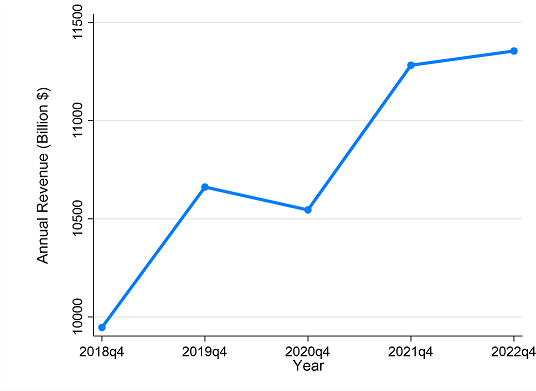
Source: BDS-SU-REV public tables.
Sectors negatively impacted by the pandemic due to reduce revenue include Manufacturing; Arts, Entertainment, and Recreation; Lodging and Food Services; and Other Services as seen in Figure 5. This last category encompasses various businesses, such as auto repair, beauty salons, and personal care services, which are reliant on in-person interactions.
Figure 5. Net real revenue creation rate (%) by sector for all firms active in quarter 4
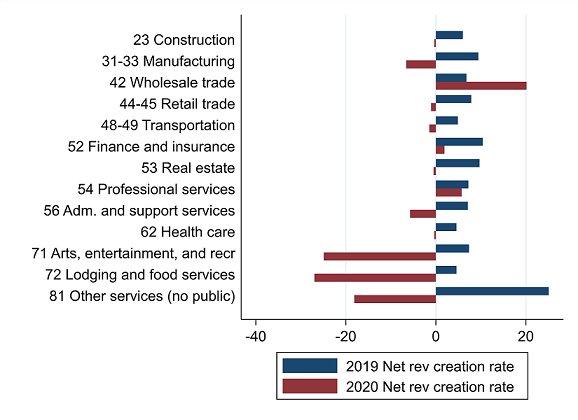
Source: BDS-SU-REV public tables.
Summary of Published Data
The BDS-SU-REV provides quarterly statistics from 2007 Q1 to 2021 Q4. There are 46 tables, each expressed in nominal and real terms. Tables are stratified by year, quarter, and firm characteristics and contain the following information:
- Total number of firms
- Total employment, payroll, and revenue
- Number of firms opening and closing
- Jobs, payroll, and revenue created by continuing firms and new firms
- Jobs, payroll, and revenue destroyed by continuing firms and closing firms
- Net job creation, payroll creation, and revenue creation
- Payroll per employee for continuing, new, and exiting firms
- Revenue per employee for continuing, new, and exiting firms
Tables are stratified by the following characteristics or some combination thereof, with 14 one-way tables, 26 two-way tables, and 8 three-way tables. In addition, there is an economy-wide table stratified only by year and quarter:
- Firm age – number of calendar quarters since the first quarter of positive payroll (six detailed categories and five coarse categories)
- Firm size – employment count (five detailed categories and three coarse categories)
- NAICS sector
- NAICS 3-digit industry
- NAICS 4-digit industry
- State
- Metro/non-metro indicator
- Rural/urban continuum – based on percentage of the county that is urban (four categories)
- MSA - Metropolitan Statistical Area (metro areas reported individually, micro areas summed)
- County
- SBA Covid Relief for businesses – participation in PPP and other small business assistance programs
Key Innovations
Unlike the main BDS, which measures firm age in years, the BDS-SU-REV measures firm age in quarters. These quarterly single-unit data have numerous advantages. First, because these businesses operate in a single place, the firm, as defined by ownership, is equivalent to the establishment, as defined by location. This simplifies the reporting of business characteristics since age and size are the same for the firm as for the establishment. Second, because the quarterly data allow us to identify the first and last quarters a business had employees, we can date business entry and exit more precisely during the year. Third, the quarterly data also capture large temporary disruptions to the economy that happen in a single year, such as the 2020 COVID-19 pandemic recession or a natural disaster, which would be missed in the traditional BDS annual March-over-March job change estimates. Finally, the quarterly data include payroll, allowing us to calculate payroll creation and destruction in an analogous manner to employment.
While the quarterly employment time series begins in 2007, quarterly payroll data exist back to 1976, allowing us to measure firm age over the same time span as the main BDS. We identify the first quarter a firm had payroll between 1976 Q1 and 2021 Q4 and then measure firm age as the number of calendar quarters between the first and current quarter. In comparison, the main BDS identifies the first year a firm had employment in the pay period that includes March 12th and then calculates firm age as the number of calendar years between the first and current year. If a firm began in the 2nd, 3rd, or 4th quarters of the year, its birth will not be recognized by the main BDS until the following year in March. This annual measurement aggregates births over all the quarters of the prior year and reports them at the end of the 1st quarter each year. The quarterly measurement of the BDS-SU-REV disaggregates these births across the four quarters of the year. The same is true for firm exits.
Another innovation of the BDS-SU-REV product is the addition of payroll and revenue measures that mirror the employment measures. These new measures include total payroll, total revenue, payroll creation (year-over-year increase), revenue creation, payroll destruction (year-over-year decrease), revenue destruction, net payroll creation (total creation minus total destruction), net revenue creation, and the portion of payroll and revenue creation attributed to new businesses ('births') and the portion of payroll and revenue destruction attributed to business closures ('deaths').
Note that while the payroll and employment variables are measured at the quarterly level, revenue is only measured annually. However, all revenue measures are presented at the quarterly level, reflecting the annual revenue generated by businesses active in that quarter. For more information, please refer to the BDS-SU-REV definition.
Finally, we publish the ratio of payroll to employment and revenue to employment for all single-unit firms, and separately for continuing, entering, and exiting firms. Comparing this ratio for different groups of firms provides information about how average pay per worker and revenue per worker (labor productivity) varies across industries and geography.
Data
BDS-Single Unit Firms Data
Download BDS-SU-REV experimental data tables.
BDS-Single Unit Firms Definitions
Learn more about the BDS-SU variables.
BDS-Single Unit Firms Methodology
Learn more about the methodology used to define single unit firms.
Publication
BDS-Single Unit Firms Related Publications
Learn more about the research that underlies this experimental data product.
Questions? Contact us at ces.bds@census.gov.

Page Last Revised - December 13, 2023
✕
Is this page helpful?
 Yes
Yes
 No
No
 Yes
Yes
 No
No✕
NO THANKS
255 characters maximum
 255 characters maximum reached
✕
Thank you for your feedback.
Comments or suggestions?

Comments or suggestions?