
Official websites use .gov
A .gov website belongs to an official government organization in the United States.
Secure .gov websites use HTTPS
A lock (
) or https:// means you’ve safely connected to the .gov website. Share sensitive information only on official, secure websites.

Topics
Data & Maps
Surveys & Programs
Resource Library
Purposes and Uses of Economic Census Data
Purposes and Uses of Economic Census Data
Census Bureau Economic Programs (including the Economic Census) provide detailed statistics that are important for industries and communities. Trade associations, chambers of commerce, and businesses rely on this information for economic development, business decisions, and strategic planning. Browse the topics below for real-life example of how businesses and organizations use these statistics.
Using Census Economic Data at a Glance
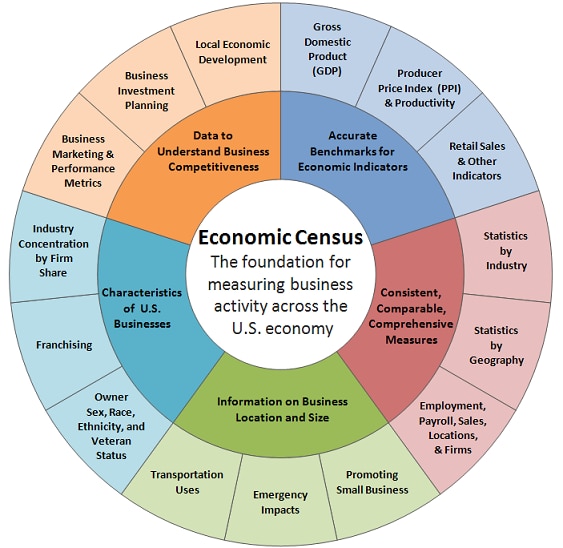
Click on the thumbnail above to preview the types of information provided by the Economic Census and how businesses, organizations, and governments (including the Census Bureau) use the data.
Real-Life Use Cases
1. Opening a New Small Business – A Bike Shop in Portland, Oregon
A successful high-end mountain bike component manufacturer considered opening his own bike shop to sell his manufactured components along with mountain bikes and other components. He used data from the American Community Survey (ACS) to identify potential customers (young professionals with moderate to high median household income) that he could then market his new business to. He also used Census business data to identify locations where Sporting Goods stores (NAICS 451110, which includes bike shops) are located. These data not only identified possible competitors to his business but also potential businesses to partner with by opening a leased department within a larger store.

(See CBB )
Using the business data from Census, he was also able to compare the payroll per employee, sales per employee, and other stats for the nine areas he considered which gave him a better understanding of his industry and what he should expect to pay his employees. These data were included in his business plan and in the application that he submitted to his local small business lender for a start-up capital loan.
2. Expanding Existing Businesses – A Restauranteur in Albuquerque, New Mexico
A restauranteur in Albuquerque, New Mexico considered adding a drive-through window to each of his five restaurants but was not sure that his sales would increase enough to warrant the required investment in equipment and personnel or the disruption to the business during the installation period. He spoke with other restauranteurs in his area who had drive-through windows about their experiences but few were willing to share information about the competitive advantage they believed they had.

(See AFF )
Using the Products Line data from the Economic Census for Limited Service Restaurants (NAICS 722513), he was able to determine that similar businesses in New Mexico typically saw around 29.3% ($406.4 Million) of their sales of food and 10.4% ($144.2 Million) of their sales of nonalcoholic beverages from their drive-through receipts. Using these data, he applied for and received a ten-year small business loan to help pay for the installation of the drive-through in each of his five locations. His sales increased enough that he was able to pay off the note in three years.
3. Re-evaluating an Existing Larger Business – A Utility Truck Manufacturer
A utility truck manufacturer was doing a periodic review of its network of dealerships and repair facilities across the U.S. They were happy to see that most of their facilities reported high customer satisfaction scores from the surveys they did with their customers, but were disappointed to see that some were not doing as well. Especially concerning was that the complaints were not about the quality of the service provided but the time it was taking to get an appointment and get the vehicle repaired. Customers also complained about the distance they had to travel (at great expense) for service. Their planning staff considered relocating some of the locations to better serve the existing customers, but senior staff were concerned about the costs.

(See CBB )
Using Census business data, headquarters staff were able to identify (on a map) the numbers of businesses (plumbing and electrical contractors) that typically used their vehicles throughout their covered service areas. They overlaid a map of their service facilities on top; doing so quickly revealed areas with many potential customers but no dealerships or repair facilities within 50 miles. They also noted that the service area of some of their under-performing facilities overlapped with other areas. Using Census data, the planning staff were able to convince senior managers that changes were needed. They decided that some facilities should be relocated and new facilities opened to better serve their markets. When the next periodic review was done, the customer satisfaction scores had significantly improved.
4. Promoting Economic Development – A Government Grant Writer in Ohio
A grant writer in Ohio prepared a request for funding to address “food deserts” (areas with no access to high-quality food) in her county and surrounding areas. She had anecdotal evidence of this issue in her area but needed clear and reliable government data to help her make the case in her grant request.

(See CBB )
Using Census Bureau economic data, she identified zip codes in her area that had no grocery stores. She then used data from the American Community Survey (ACS) to refine these identified areas to just those with a vulnerable local population; areas with low median household income, high disability status, high population over 65, and limited access to transportation. She included these identified areas (and the demographic and business data for them) in her grant proposal and was awarded the grant to help fund entrepreneurs to open grocery stores in these areas.
5. Shaping Tax Policy – Maryland Cigarette Taxes
The state of Maryland was considering an increase in the state taxes levied on the sale of cigarettes and other tobacco products. The state was not only concerned about the impact on buyers of tobacco products (and how this increase might impact the customer’s ability to purchase them), but also the impact on the businesses that sell them in the state.

To identify the types of businesses impacted and to help then judge the level of the impact, state employees used the Product Lines data from the Economic Census. These data helped identify that Convenience Stores are the primary sellers of tobacco products in Maryland, and that these products accounted for an average of 18.1% ($121.2 Million) of all sales. Using the business size data also available from the Census Bureau, they identified that the vast majority of Convenience Stores have fewer than five employees. After reviewing the data, state officials decided not to increase these taxes due to the detrimental impact this increase might have on these small businesses.
6. Emergency Response - Emergency Management Officials in South Florida
Emergency management officials in South Florida were tasked with evaluating how vulnerable their areas were to major weather events. They initially focused on residents of their areas, and used the Census Bureau’s American Community Survey (ACS) to better understand these populations. They then expanded their research to include businesses, especially in industries that they found critical (hospitals and other health care providers, building material dealers, etc.).

(See LEHD )
Using the Census business data they were able to identify the workforce size and jobs concentration for those key businesses that might be impacted during a major weather event. In addition, they established protocols on how they could help ensure that these businesses remained open during and after these events, and what resources would be needed to ensure this.
Page Last Revised - November 22, 2021
✕
Is this page helpful?
 Yes
Yes
 No
No
 Yes
Yes
 No
No✕
NO THANKS
255 characters maximum
 255 characters maximum reached
✕
Thank you for your feedback.
Comments or suggestions?

Comments or suggestions?