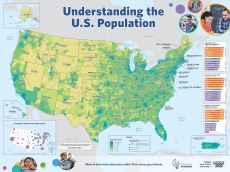
SIS Middle School Map: Understanding the U.S. Population

This map explains the U.S. population by providing data on the states with the youngest and oldest populations, the highest and lowest average family size, and the highest and lowest median income. The content in this map is best suited for middle school students.
Access the Map
Page Last Revised - September 19, 2022


