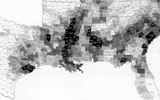
Slavery, Geography, and Politics - The Impact of a 19th Century Population Density Map
Slavery, Geography, and Politics - The Impact of a 19th Century Population Density Map
Activity Description

Students will analyze multiple resources to learn how President Abraham Lincoln and Union forces used a 19th century population density map of enslaved people in the southern United States to help Americans understand the social implications of slavery during the Civil War. This marked the first time in U.S. history that a statistical map was used for this purpose.
Suggested Grade Level
11-12
Approximate Time Required
75 minutes
Learning Objectives
- Students will be able to analyze and interpret a historical map (showing the population density of enslaved people in the southern United States), an opinion piece, and a painting.
- Students will be able to explain how decision-makers, such as President Abraham Lincoln, likely used the map during the Civil War.
Materials Required
- The student version of this activity, 3 pages
- A computer with Internet access for each student
Activity Items
This activity uses the following online resources:
Mapping Slavery in the Nineteenth Century
www.census.gov/library/visualizations/1861/dec/distribution-of-slaves-in-1860.html
“Visualizing Slavery,” a 2010 opinion piece in The New York Times, by Susan Schulten
opinionator.blogs.nytimes.com/2010/12/09/visualizing-slavery/?_r=2
Teacher Notes
Blooms Taxonomy

Students will evaluate the impact of data on political and military strategies in the United States during the 19th century.
Subject
High School History
Topics
- Choropleth maps
- The Civil War
- Population density
- Slavery
- Statistical maps
Skills Taught
- Drawing conclusions
- Examining primary and secondary sources
- Making an argument
- Reading and interpreting maps


