Data Visualization - Increasing Urbanization Population Distribution
Resource Description
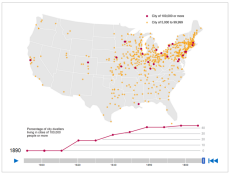
This data visualization reveals how the number and size of cities has increased between 1790 and 1890. By 1890, the countries population grew and became increasingly urban, people living in cities of 100,000 or more made up a larger proportion of all urban dwellers. This map illustrates how society transformed from being rural and agricultural to becoming industrial.
Access the Visualization
Page Last Revised - October 8, 2021


