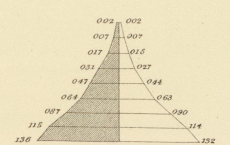
1870 Age Pyramids for the United States
This historical chart allows users to compare age pyramids for different states in the U.S. using 1870 Decennial Census population data. The age pyramid conveys the proportions (in thousandths) of male (left side of the perpendicular line) and female populations (right side of the perpendicular line) in each age category (0-10, 10-20, 20-30, 30-40, 40-50, 50-60, 60-70, 70-80, 80 and older).
Access the Diagram or Table
Page Last Revised - December 16, 2021


