Blooming States
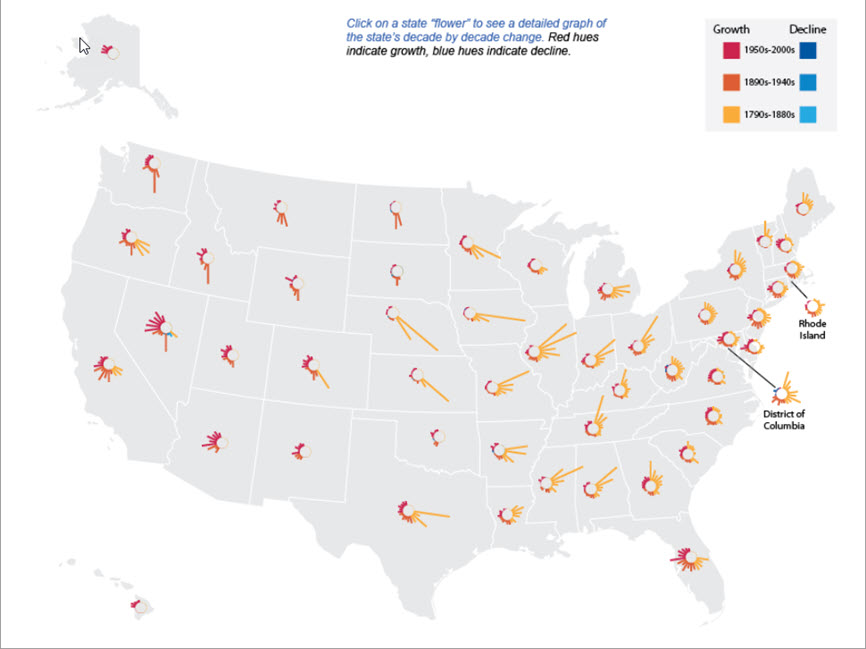
This interactive visualization shows the state-by-state population growth measured by the decennial censuses from 1790 to 2010. Data reflect unrevised population figures and are for states following statehood as well as the District of Columbia. Figures for Maine, Massachusetts, West Virginia, and Virginia are based on current geography.
Activity Using This Resource
Using Interactive Maps to Interpret U.S. Territorial Expansion
Students will explore an interactive data visualization of state-by-state population growth as measured by the decennial censuses of 1790 through 2010.
Page Last Revised - July 30, 2025