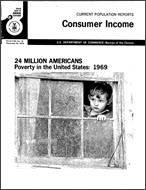
24 Million Americans—Poverty in the United States: 1969
24 Million Americans—Poverty in the United States: 1969
This report presents statistics on poverty in the United States in 1969, based on the March 1970 Current Population Survey. The detailed tables present data for such characteristics of the poor as race, family status, size of family, employment status, work experience, occupation, education, earnings, income, and income deficit. Where available, data are presented for three racial classifications: (1) all races, (2) white, and (3) Negro. Although the primary focus of this report is on the United States as a whole, poverty data are also presented by region and type of residence. A description of the poor in 1969 and some analysis of the changes in the composition of the poor that have occurred between 1968 and 1969 and during the past decade are included.
This is the second Census Bureau report to present detailed poverty data based on the revised poverty definition adopted as the official standard in 1969 (see Definitions and Explanations, page 15, for a description of the revised definition). Since the detailed tables in this report cover one year only, they are more comprehensive than those found in the first report, "Poverty in the United States: 1959 to 1968," Current Population Reports, Series P-60, No. 68.
Some highlights of the data presented in this report are:
- In 1969, 24.3 million persons had incomes below the poverty level, a decrease of 1.1 million since 1968 and 15.2 million over the past decade. There was no significant change in the number of poor families between 1968 and 1969, but a 41 percent decline since 1959. Poor families headed by a man decreased by about one-half during this 10-year period, while there was no significant change in the number of poor families headed by a woman. Persons of Negro and other races constituted 31 percent of the poor in 1969, although they comprised only 12 percent of the total population.
- The proportion of persons below the poverty level decreased slightly between 1968 and 1969, from 12.8 percent to 12.2 percent. About 1 out of 10 families were poor in 1969, compared with about 1 out of 5 in 1959. Families headed by a person of Negro and other races were poor at a rate of about 27 percent in 1969, more than three times the poverty rate of about 8 percent for white families.
- In 1959, poor persons were about equally distributed between the South and the remainder of the country. By 1969, 54 percent of the poor lived outside the South. Over the past 10 years the proportion of the poverty population living in metropolitan areas has increased from about 44 percent to 51 percent. About 36 percent of the poor in the South lived in metropolitan areas in 1969 compared with 63 percent in the North and West.
- Sixty-one percent of poor male family heads and 43 percent of poor female family heads worked in 1969. About 90 percent of poor male heads who did not work were either ill or disabled, or can be presumed to be retired. About 72 percent of poor female heads who did not work gave family and home responsibilities as their main reason for not working in 1969.
- Poor Negro heads of families were more likely to have worked than their white counterparts. Seventy-one percent of the Negro male heads worked in 1969 compared with 59 percent for white male heads. For female heads of families the corresponding figures were 49 percent and 39 percent, respectively.
- While about two-thirds of all poor families had income from earnings in 1969, earnings accounted for only about one-half of their total aggregate income. In contrast, income from earnings accounted for about nine-tenths of the aggregate income for families above the poverty level. The largest categories of other income for poor families were social security payments and public assistance, from which 32 percent and 27 percent, respectively, of all poor families, received benefits.
- In 1969, it would have taken approximately $10.1 billion to raise the aggregate incomes of all poor families to the poverty level. The average poverty gap for poor families in 1969 was $1,280. Fourteen percent of all poor families had deficits within $250 of their respective poverty thresholds.
- By decreasing the various poverty thresholds to 75 percent of the existing thresholds, the number of poor persons would drop by 40 percent in 1969, and the poverty rate for persons would drop from 12 percent to 7 percent. Conversely, increasing the poverty thresholds to 125 percent of the existing thresholds would increase the poverty population by 44 percent and raise the poverty rate to 17 percent. As the poverty level is increased, the proportion of the poor who are white increases slightly.
A Note on Language
Census statistics date back to 1790 and reflect the growth and change of the United States. Past census reports contain some terms that today’s readers may consider obsolete and inappropriate. As part of our goal to be open and transparent with the public, we are improving access to all Census Bureau original publications and statistics, which serve as a guide to the nation's history.
Others in Series
Publication
Publication
Publication


