Money Income in 1978 of Households in the United States
Money Income in 1978 of Households in the United States
Note
As part of the March 1979 Current Population Survey (CPS), the Bureau of the Census conducted an experiment in an effort to improve the reporting of income. For the purpose of the experiment, the full CPS sample was divided into two samples representative of the U.S. population. An experimental questionnaire was used for one sample consisting of three-eighths of the full sample, and the traditional questionnaire was used for the remaining five-eighths of the full sample. In this text, the income estimates cited for 1978 are based on the full sample. In addition, the full sample for 1978 was also used to measure changes from 1977. A discussion of the experiment and its impact on the 1978 household income data is provided in a later section entitled, ''The March 1979 CPS Income Experiment."
Money Income in 1978
The median money income of households in the United States rose to $15,060 in 1978, an increase of 11 percent over the 1977 median of $13,570. Although most of this increase was eroded by rising prices, the net gain in real purchasing power was still statistically significant. After adjusting for the 7.6 percent increase in prices between 1977 and 1978,1 the 1978 median in terms of constant dollars increased by 3 percent over the 1977 median.
Changes in real median household income have been mixed during the 1970's. Real median household income increased by 5 percent between 1970 and 1973, but this was followed by a 7-percent decrease during the recessionary period from 1973 to 1975 which more than offset the gain. (See table A.) Although real median household income increased by 5 percent between 1975 and 1978, the 1978 median ($15,060) was only 3 percent higher than the 1970 median ($14,670) in real terms.
The lack of growth in real median household income is due in part to the changing composition of households during the 1970's. Between March 1971 and March 1979, the proportion of households with husband-wife families declined from 69.4 to 61.6 percent, family households with no spouse present increased from 11.1 to 12.7 percent, and nonfamily households increased from 19.6 to 25.6 percent of all households.2 These trends have a tendency to lower the average number of persons per household, which declined from 3.11 in March 1971 to 2.78 in March 1979. Husband-wife households, which are a relatively high income group, are now a smaller proportion of all households. This trend along with smaller household size has created downward pressure on the median household income.
In contrast to the unencouraging performance of real median household income during the 1970's, there was a significant improvement in real per capita income. Between 1970 and 1973, per capita household income increased by 12 percent, but decreased by 4 percent during the next 2 years (table A). The subsequent 10-percent increase between 1975 and 1978 combined with the earlier changes resulted in an 18-percent increase in real per capita income between 1970 and 1978. This presents a more optimistic picture than comparisons of median household income, since per capita income measures the average income available to all individuals.
Aggregate household money income increased by 12 percent between 1977 and 1978 as a result of a 2-percent increase in the number of households (1.3 million additional households) and a 10-percent increase in the average (mean) household money income. After adjusting for inflation, the 1978 aggregate household income represented an increase of 4 percent over the 1977 figure.
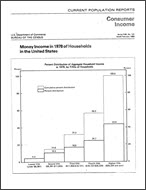
Of the 77.3 million households in the United States in March 1979, 17.6 million (22.8 percent) had incomes of $25,000 or more in 1978; these households received 48.1 percent of aggregate income in 1978. Another 21.3 million households (27.5 percent) had incomes between $15,000 and $25,000 and received 30.3 percent of aggregate income. At the other end of the scale, 11.4 million households (14.7 percent) had incomes under $5,000 and received 2.4 percent of the aggregate income (table B).
__________
1 The percentage increase in prices between 1977 and 1978 is computed by dividing the annual average Consumer Price Index (CPI) for 1978 by the annual average value of the CPI for 1977.
2 More detailed information on households by type from the March 1979 CPS can be found in Current Population Reports, Series P-20, No. 345.
A Note on Language
Census statistics date back to 1790 and reflect the growth and change of the United States. Past census reports contain some terms that today’s readers may consider obsolete and inappropriate. As part of our goal to be open and transparent with the public, we are improving access to all Census Bureau original publications and statistics, which serve as a guide to the nation's history.
Others in Series
Publication
Publication
Publication


