
Official websites use .gov
A .gov website belongs to an official government organization in the United States.
Secure .gov websites use HTTPS
A lock (
) or https:// means you’ve safely connected to the .gov website. Share sensitive information only on official, secure websites.

Topics
Data & Maps
Surveys & Programs
Resource Library
Historical Reported Voting Rates
Historical Reported Voting Rates
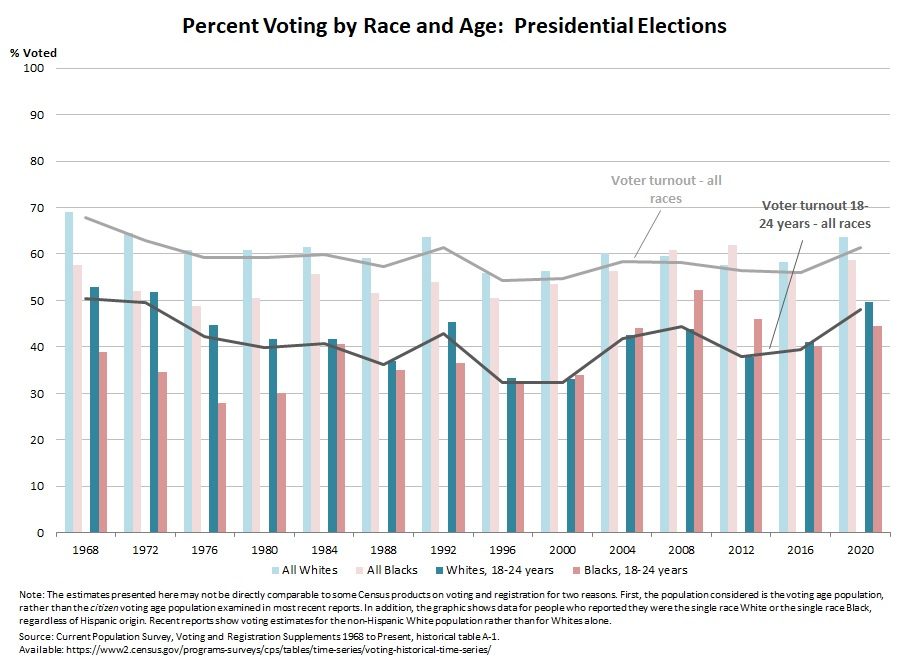
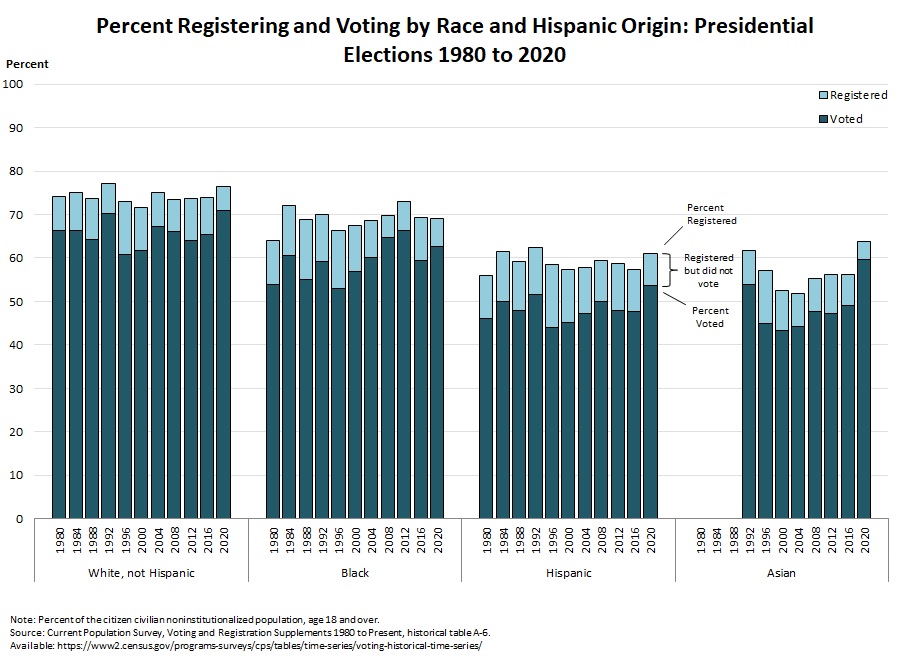
Below are a series of graphs taken from the CPS historical voting tables showing trends in voting. They are meant to show the usefulness of the voting historical tables. Click here to find the tables.
Table A-1
Reported Voting and Registration by Race, Hispanic Origin, Sex and Age Groups: November 1964 to 2020
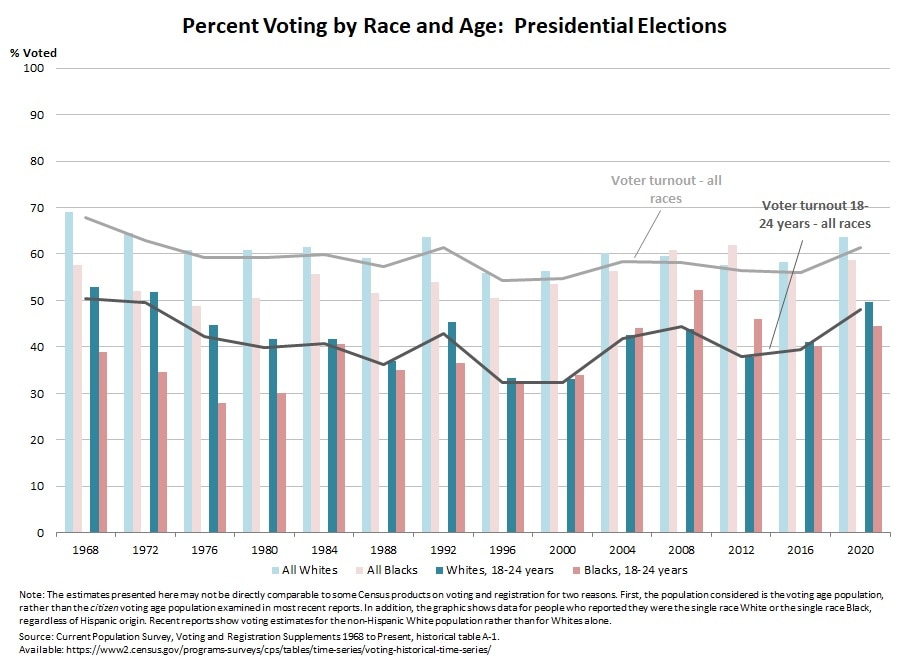


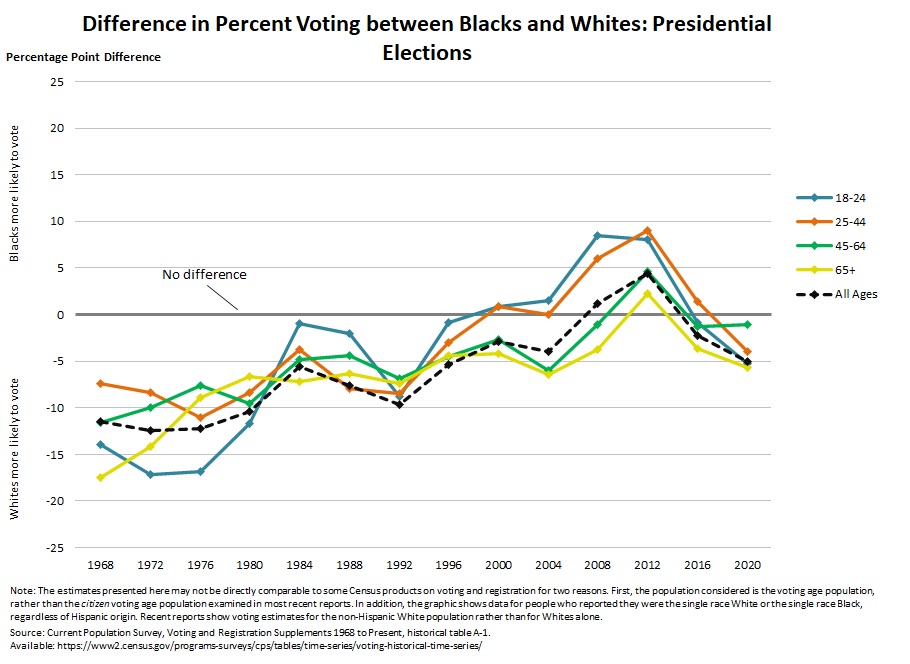
Table A-2
Reported Voting and Registration by Region, Educational Attainment and Labor Force Status for the Population 18 and Over: November 1964 to 2020

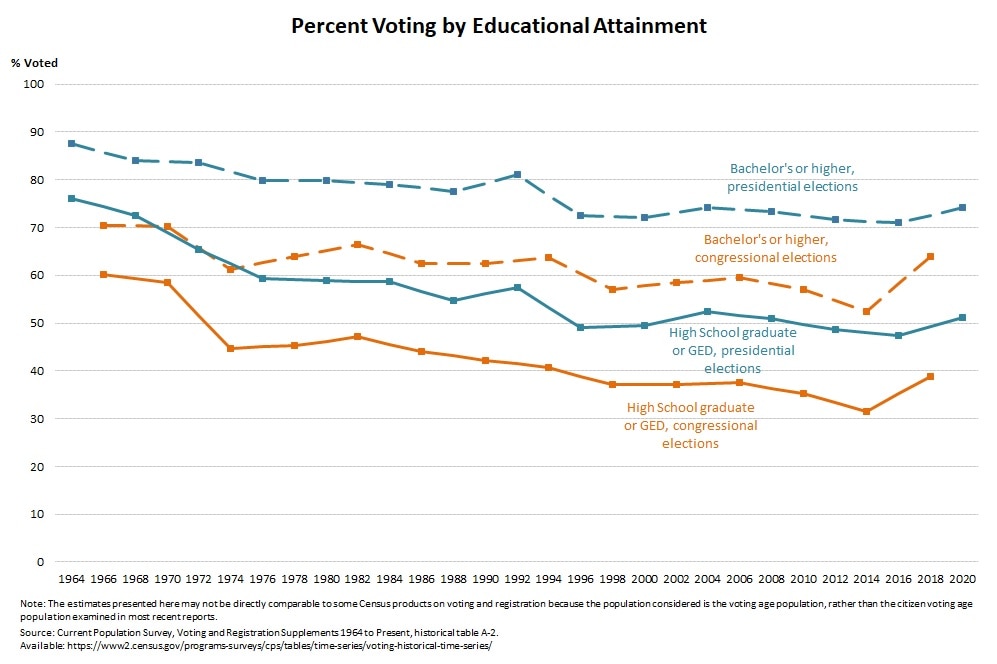

Table A-4
Reported Voting and Registration for Total and Citizen Voting-Age Population for Congressional Elections: 1978-2018
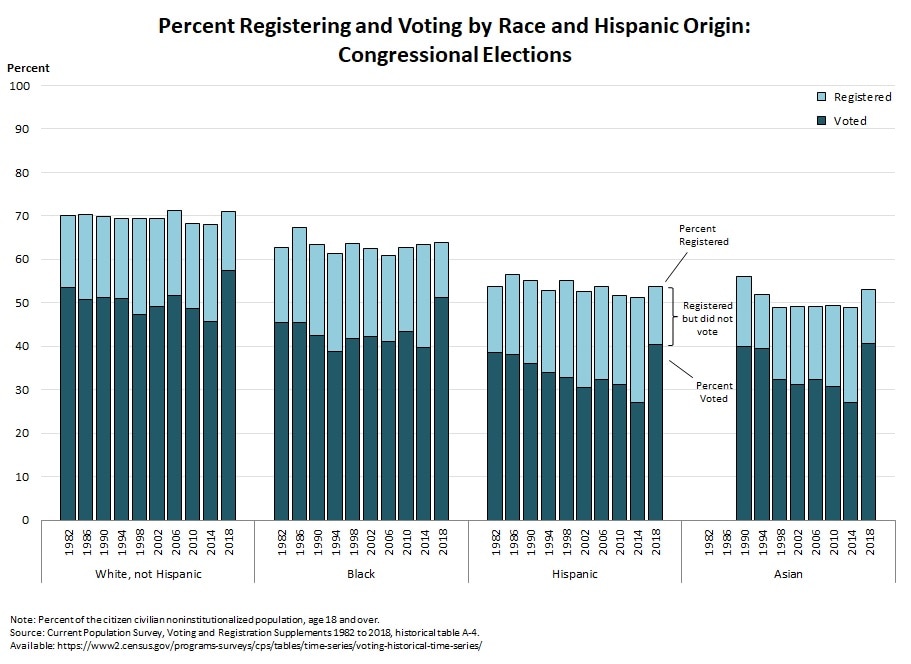
Table A-6
Reported Voting and Registration for Total and Citizen Voting-Age Population, By Race and Hispanic Origin: Presidential Elections 1980-2020
Related Information
VISUALIZATION
Voting and Registration Visualizations
Page Last Revised - October 26, 2021
✕
Is this page helpful?
 Yes
Yes
 No
No
 Yes
Yes
 No
No✕
NO THANKS
255 characters maximum
 255 characters maximum reached
✕
Thank you for your feedback.
Comments or suggestions?

Comments or suggestions?