U.S. flag

An official website of the United States government

Skip Header


Press Kit: The Changing Economics and Demographics of Young Adulthood from 1975 to 2016

Figures

.png Figure 1. Finishing School and Getting a Job (How important are these experiences to becoming an adult) [<1.0 MB]
Figure 1. Finishing School and Getting a Job (How important are these experiences to becoming an adult)
.png Figure 2. Family Delayed, but Not Forgone (Adults Who Have Ever Had a Child or Married: Percentage Change From 1976 to 2014) [<1.0 MB]
Figure 2. Family Delayed, but Not Forgone (Adults Who Have Ever Had a Child or Married: Percentage Change From 1976 to 2014)
.png Figure 3. More Young Adults Lived With Parents Than a Spouse in 2016 (Living Arrangements Among Adults Aged 18 to 34: 1975 and 2016) [<1.0 MB]
Figure 3. More Young Adults Lived With Parents Than a Spouse in 2016 (Living Arrangements Among Adults Aged 18 to 34: 1975 and 2016)
.png Figure 4. Who’s at home? (Living Arrangements of Young Adults Aged 18 to 34: 2016 in percent) [<1.0 MB]
Figure 4. Who’s at home? (Living Arrangements of Young Adults Aged 18 to 34: 2016 in percent)
.png Figure 5. Out of four common milestones of adulthood-getting married, having children, working, and living independently-what are the most common combinations that young adults have completed? (Percent of young adults aged 25 to 34) [<1.0 MB]
Figure 5. Out of four common milestones of adulthood-getting married, having children, working, and living independently-what are the most common combinations that young adults have completed? (Percent of young adults aged 25 to 34)

Tables

.png Table 1: Milestones of Adulthood (How important are these experiences to becoming an adult?) [<1.0 MB]
Table 1: Milestones of Adulthood (How important are these experiences to becoming an adult?)
.png Table 2: Young Women’s Economic Gains Are Outpacing Men’s (Economic and Educational Characteristics of Young Adults Aged 25 to 34: in percent) 1975 to 2016 [<1.0 MB]
Table 2: Young Women’s Economic Gains Are Outpacing Men’s (Economic and Educational Characteristics of Young Adults Aged 25 to 34: in percent) 1975 to 2016
.png Table 3: A Decade of Change: The State of Young Adult Living Arrangements (Change in Living Arrangements for Young Adults Aged 18 to 34 between 2005 and 2015) [<1.0 MB]
Table 3: A Decade of Change: The State of Young Adult Living Arrangements (Change in Living Arrangements for Young Adults Aged 18 to 34 between 2005 and 2015)
.png Table 4: More Than Half of Younger Millennials Live in Their Parents’ Home (Demographic and Economic Characteristics of Young Adults Aged 18 to 24: 2015) [<1.0 MB]
Table 4: More Than Half of Younger Millennials Live in Their Parents’ Home (Demographic and Economic Characteristics of Young Adults Aged 18 to 24: 2015)
.png Table 5: Less Than Two-Thirds of Older Millennials Live Independently (Demographic and Economic Characteristics of Young Adults Aged 25 to 34: 2015) [<1.0 MB]
Table 5: Less Than Two-Thirds of Older Millennials Live Independently (Demographic and Economic Characteristics of Young Adults Aged 25 to 34: 2015)
.png Table 6: One in Four Young People Living at Home Are Neither in School nor Working (Characteristics of Young Adults Aged 25 to 34 Living in the Parents’ Home in 2015) [<1.0 MB]
Table 6: One in Four Young People Living at Home Are Neither in School nor Working (Characteristics of Young Adults Aged 25 to 34 Living in the Parents’ Home in 2015)
.png Appendix Table A: Standard Errors for Table 3 [<1.0 MB]
Appendix Table A: Standard Errors for Table 3
.png Appendix Table B: Standard Errors for Table 4 [<1.0 MB]
Appendix Table B: Standard Errors for Table 4
.png Appendix Table C: Standard Errors for Table 5 [<1.0 MB]
Appendix Table C: Standard Errors for Table 5
.png Appendix Table D: Standard Errors for Table 6 [<1.0 MB]
Appendix Table D: Standard Errors for Table 6

Sound Bites (downloadable)

Young Adult Report: Women Work

  • With Lower Third (MP4)
  • Without Lower Third (MP4)

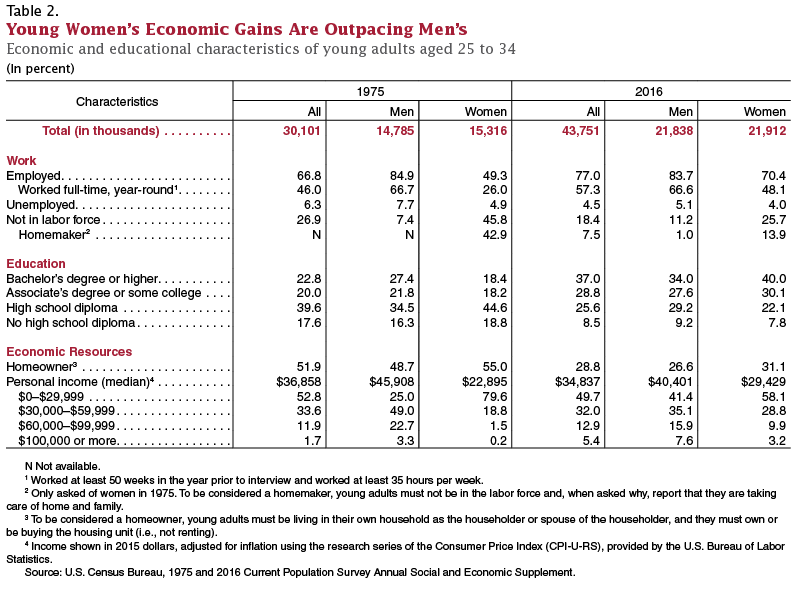
Transcript (SRT): Between 1975 and 2016, the share of young women who are homemakers fell from 43 percent to just 14 percent of all women age 25 to 34.

Young Adult Report: Men Income

  • With Lower Third (MP4)
  • Without Lower Third (MP4)

Transcript (SRT): More young men are falling to the bottom of the income ladder. In 1975, only 25 percent, age 25 to 34, had incomes less than 30 thousand dollars per year. But by 2016, that share rose to 41 percent of young men.

Young Adult Report: Living with Parents

  • With Lower Third (MP4)
  • Without Lower Third (MP4)

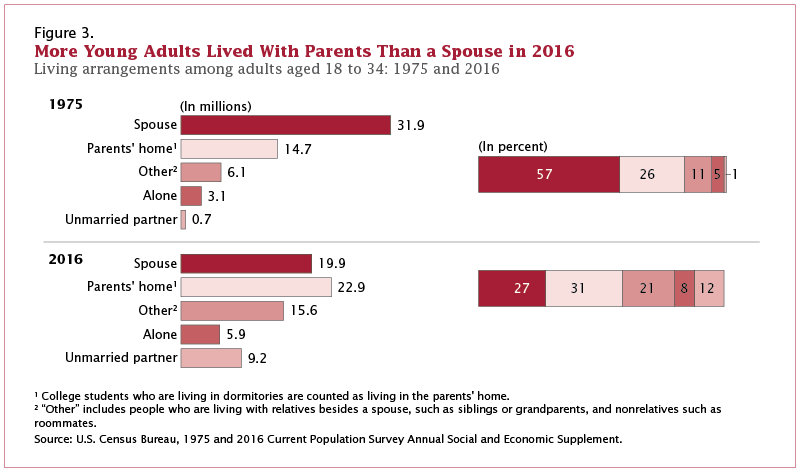
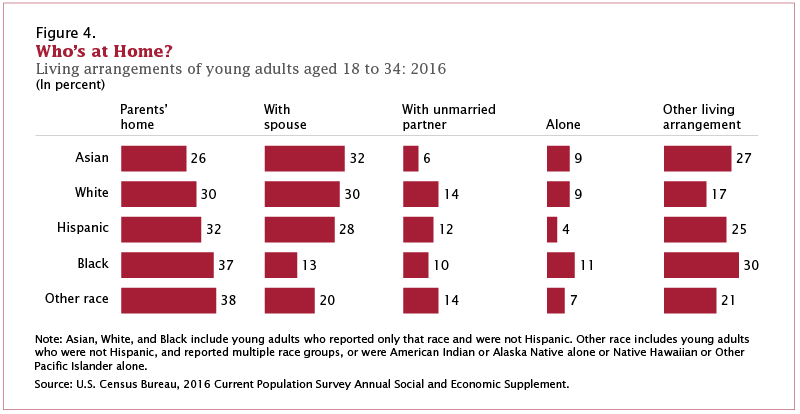
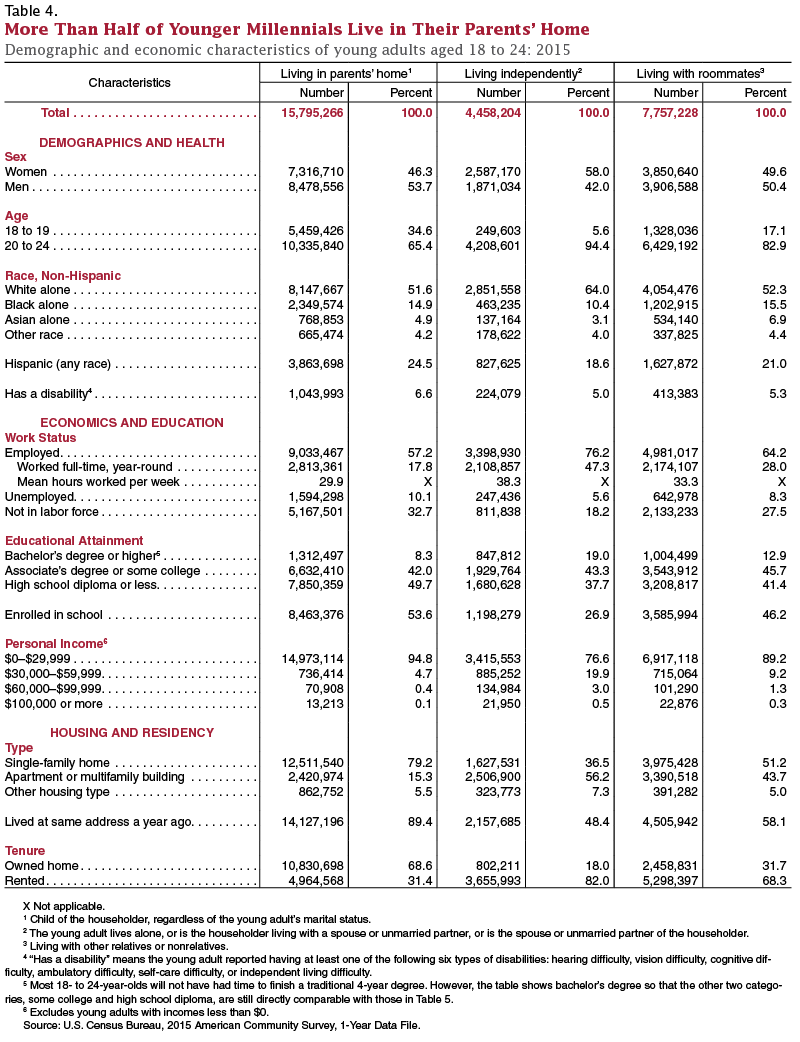
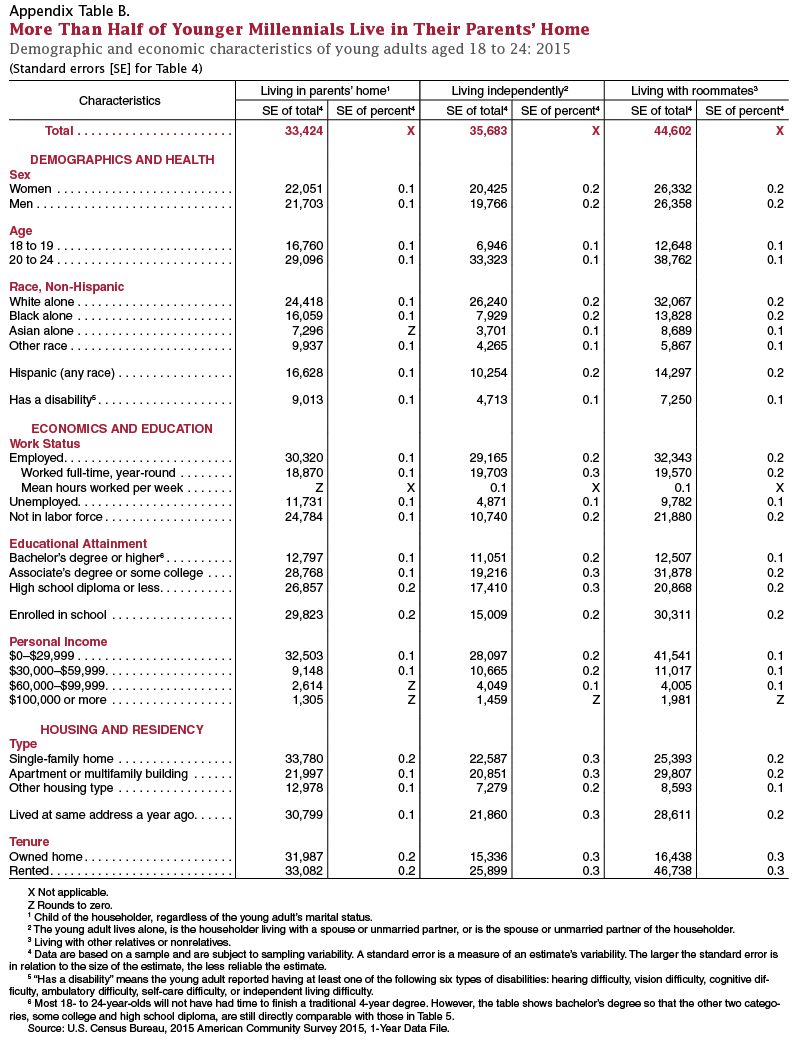
Transcript (SRT): More young people today live in their parent’s home than in any other arrangement. 1 in 3 young people or about 24 million lived in their parent’s home in 2015.

Young Adult Report: Independent Living

  • With Lower Third (MP4)
  • Without Lower Third (MP4)

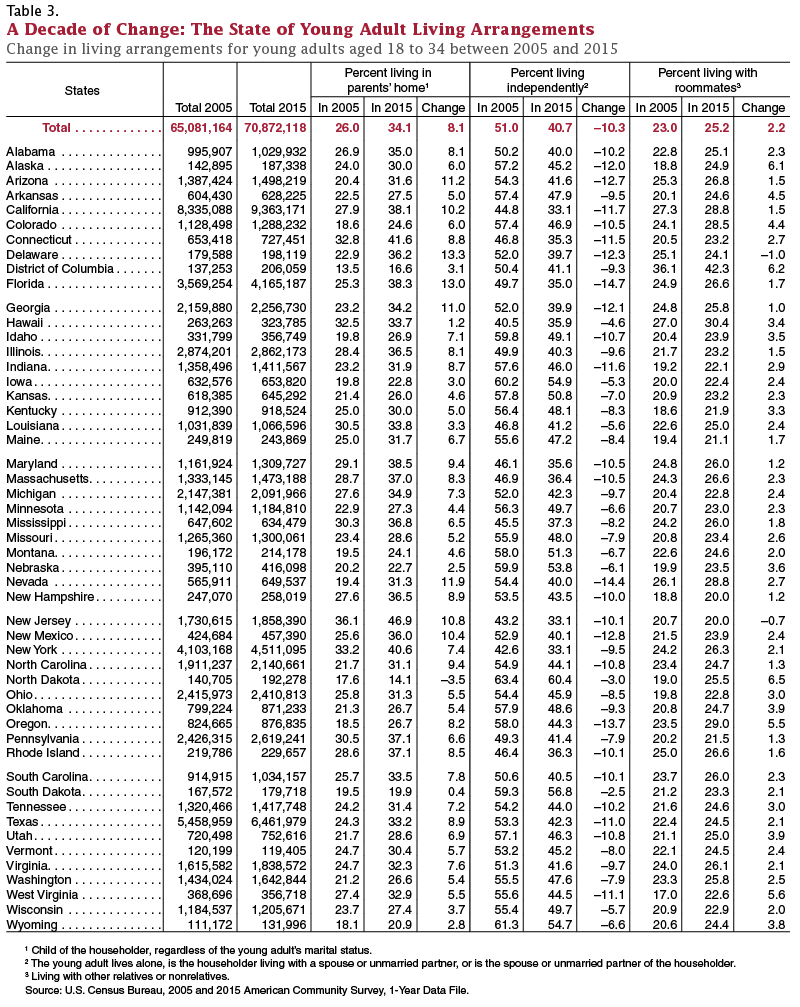
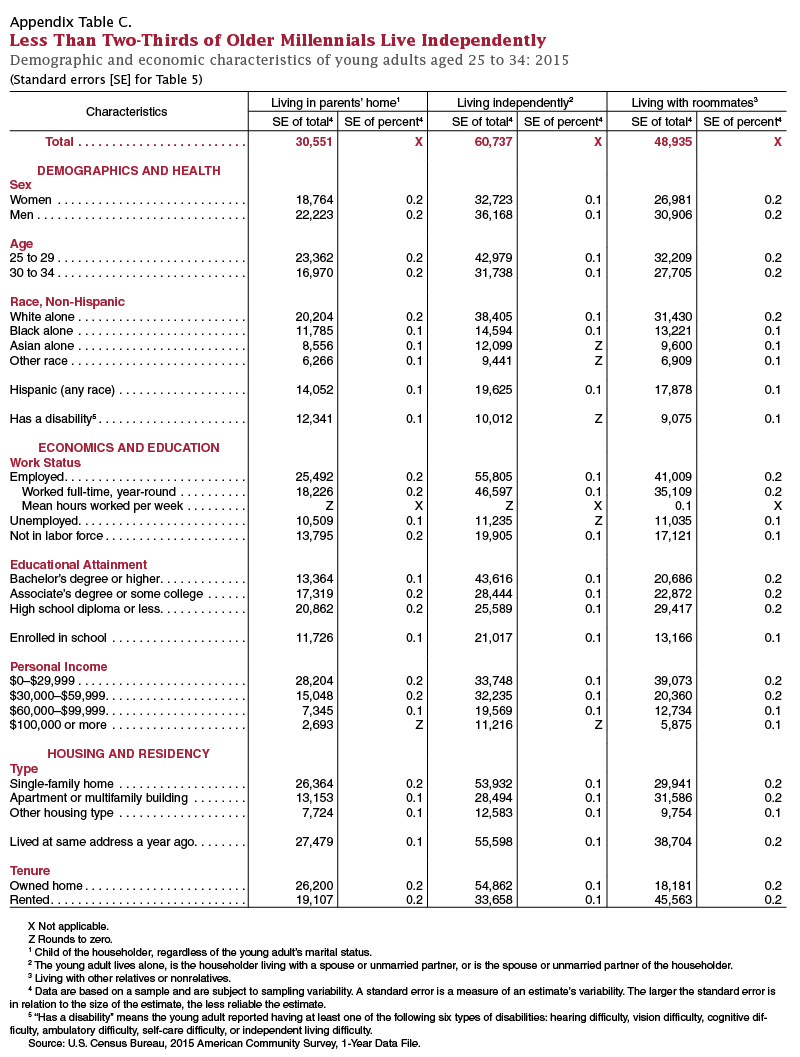
Transcript (SRT): In 2005, the majority of young adults lived independently in their own household. This was the predominant living arrangement in 35 states. Just a decade later, the number of states with the majority of young people lived independently fell to just 6.


Young Adult Report: Idle

  • With Lower Third (MP4)
  • Without Lower Third (MP4)

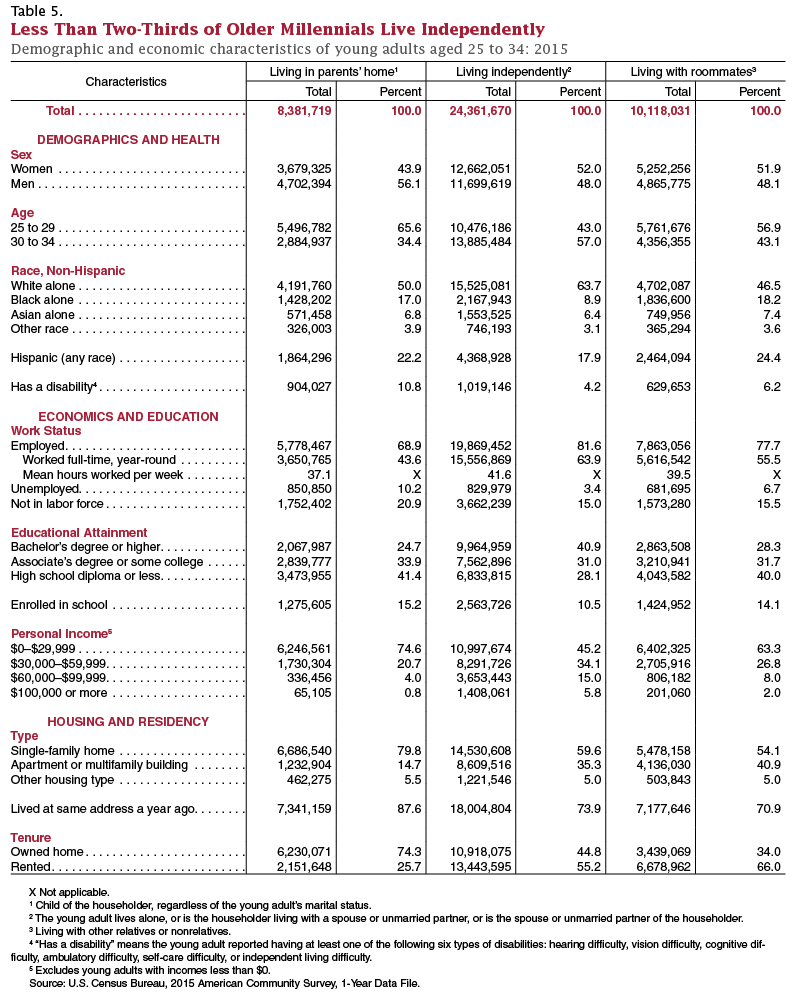
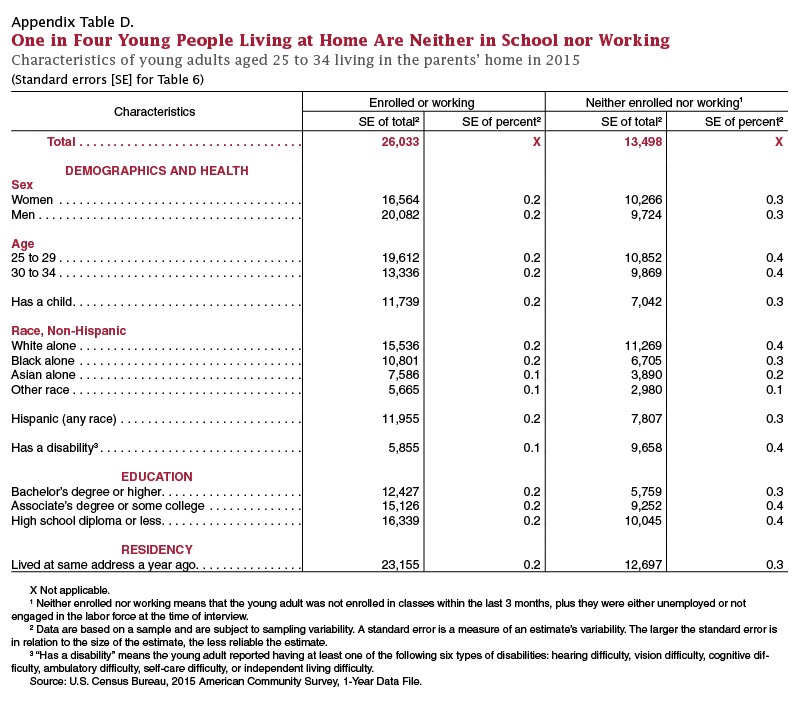
Transcript (SRT): 1 in 4 young people living in their parent’s home are idle. That is they neither go to school nor work. This figure represents about 2.2 million 25 to 34 year olds living in their parent’s home.

Young Adult Report: Education

  • With Lower Third (MP4)
  • Without Lower Third (MP4)

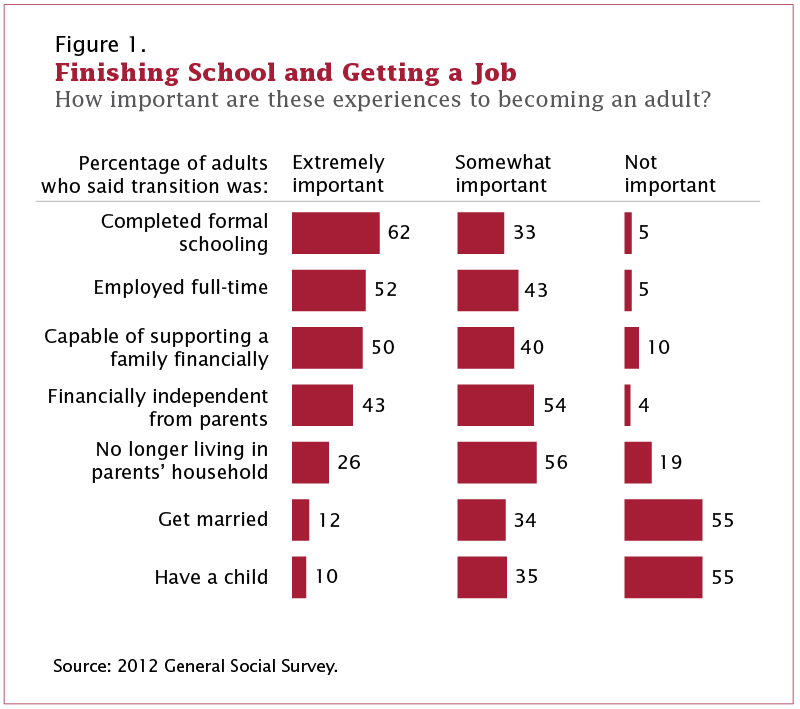
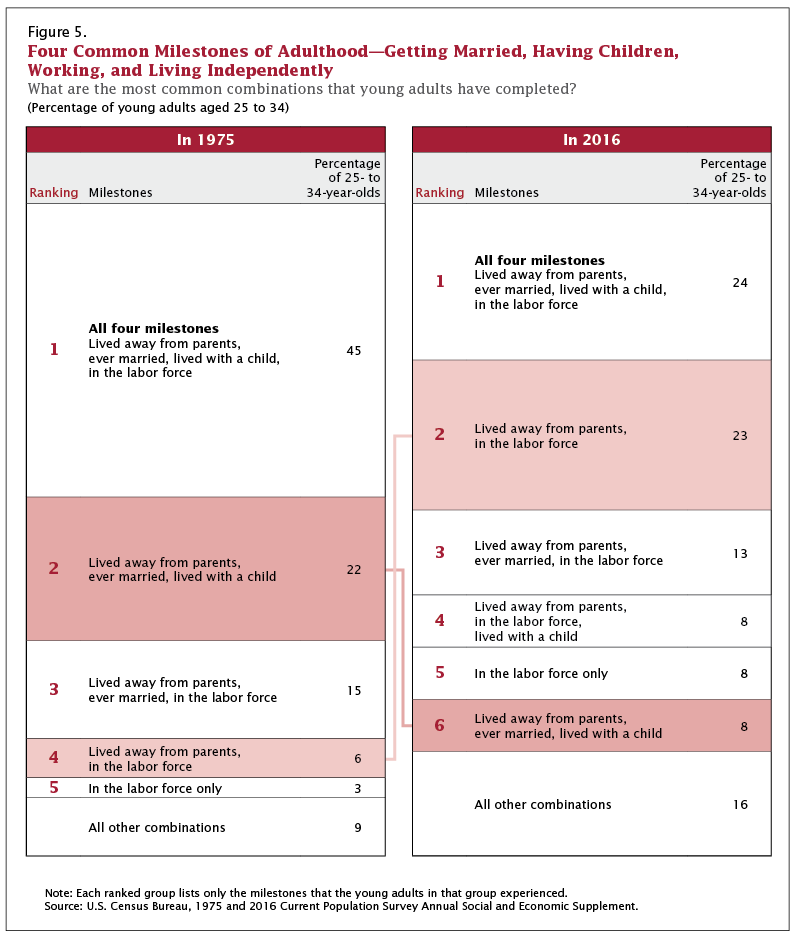
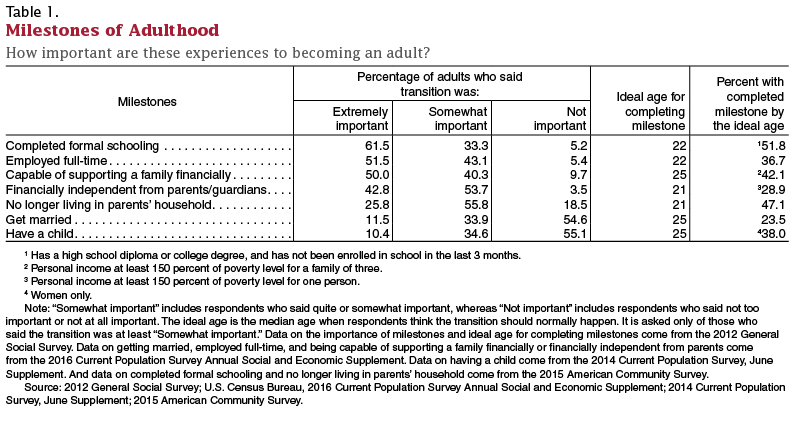
Transcript (SRT): Most of today’s Americans believe that educational and economic accomplishments are extremely important milestones in adulthood. In contrast, marriage and parenthood rank low. Over half of Americans believe that marrying and having children are not very important in order to become an adult.


Public Information Office Contacts

Page Last Revised - December 16, 2021
Is this page helpful?
Thumbs Up Image Yes Thumbs Down Image No
NO THANKS
255 characters maximum 255 characters maximum reached
Thank you for your feedback.
Comments or suggestions?

Top

Back to Header