An official website of the United States government
Here’s how you know
Official websites use .gov
A .gov website belongs to an official government organization in the United States.
Secure .gov websites use HTTPS
A lock (
) or https:// means you’ve safely connected to the .gov website. Share sensitive information only on official, secure websites.
-
//
- Census.gov /
- Newsroom /
- News Releases /
- U.S. Census Bureau Releases Small Area Income and Poverty Estimates
U.S. Census Bureau Releases Small Area Income and Poverty Estimates for States, Counties and School Districts
For Immediate Release: Thursday, December 12, 2019
U.S. Census Bureau Releases Small Area Income and Poverty Estimates for States, Counties and School Districts
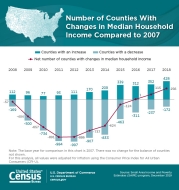
DEC. 12, 2019 — In 2018, 13.6% of counties had a statistically significant increase in median household income compared with 2007, the year before the most recent recession, while 5.5% had a statistically significant decrease, according to data released today by the Census Bureau.
The new data come from the Small Area Income and Poverty Estimates (SAIPE) program, which provides the only up-to-date, single-year income and poverty statistics for the nation’s 3,141 counties and 13,197 school districts. The tables provide statistics on the number of people in poverty, the number of children younger than age 5 in poverty (for states only), the number of children ages 5 to 17 in families in poverty, the number of children younger than age 18 in poverty, and median household income. At the school district level, estimates are available for the total population, the number of children ages 5 to 17 and the number of children ages 5 to 17 in families in poverty.
Income highlight:
- County-level median household income estimates ranged from $25,385 to $140,382, with a median income of $50,568 for all counties in 2018.
Along with median household income, county-level poverty estimates were also released, ranging from 2.6% to 54.0%, with a median poverty rate of 14.1% for all counties.
Poverty highlights:
- In 2018, the county-level poverty rate for school-age children (ages 5 to 17) ranged between 2.1% and 66.5%, with a median county-level rate of 18.8%.
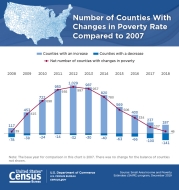
- When compared with 2007, 4.5% of counties had a statistically significant decrease in 2018, while 6.0% of counties had a statistically significant increase.
- For all school districts, the median estimated poverty rate for school-age children was 14.9% in 2018.
Statistics from the SAIPE program are used to allocate funding under Title I of the Elementary and Secondary Education Act. Title I funding is distributed to school districts based on their number and percentage of low-income children. The U.S. Department of Education expects to use the 2018 estimates to calculate fiscal year 2020 allocations for Title I and several other federal education programs for use by states and school districts primarily in the 2020-2021 school year.
No news release associated with this report. Tip Sheet only.
###
Share
Contact
Kristina Barrett
Public Information Office
301-763-3030
pio@census.gov
Related Information
 Yes
Yes
 No
NoComments or suggestions?


Top


