
Official websites use .gov
A .gov website belongs to an official government organization in the United States.
Secure .gov websites use HTTPS
A lock (
) or https:// means you’ve safely connected to the .gov website. Share sensitive information only on official, secure websites.

Topics
Data & Maps
Surveys & Programs
Resource Library
San Francisco University High School Uses ACS Data to Teach Statistics
Leah Dorazio, Instructor of Mathematics
San Francisco University High School
Data Story
As a high school statistics teacher, I learned that the best way to explain statistical concepts to students is using real world data.
Utilizing information from trusted sources, such as the American Community Survey (ACS), is an effective way to motivate and engage my classroom. ACS data are also featured in the open source textbook, Advanced High School Statistics, which I co-authored. The ACS dataset was large enough to demonstrate a variety of statistical graphs for multiple variables, and it was interesting and motivating to students learning the subject. In addition to teaching statistical concepts, we also wanted the textbook to show students that statistics are not just theoretical; it’s also about real and important work.
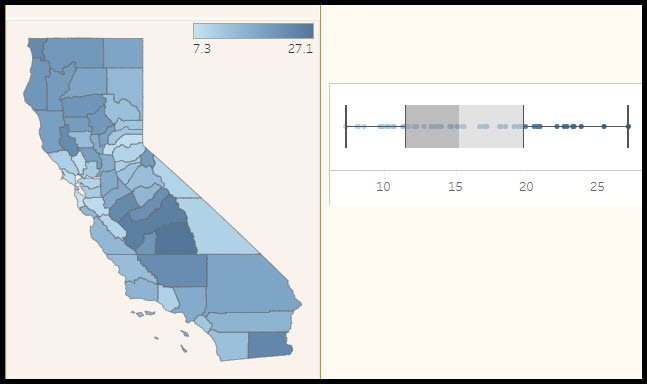
I also created interactive visualizations (see other examples here and here) that showcase ACS data so students could interact with graphs, ask questions, form hypotheses, and check their intuition. Being able to ask their own questions and then easily graph the variables of interest definitely increased my students’ curiosity and engagement. In other words, ACS data open their eyes to the fact that statistics are not just a set of skills, but applicable and valuable in life outside the classroom!
Outcome
There was a noticeable increase in student engagement and curiosity about data after I incorporated the American Community Survey into my curriculum. ACS data allowed my students to look at real data on important subjects, such as educational attainment, income, and race, for their community. Through class exercises, such as making boxplots and scatterplots, my students developed a deeper understanding of how to read and interpret graphs, and they began to understand summary statistics. Students often want to learn more so they can answer their own questions, and they are more interested in pursuing careers in statistics, data science, and data visualization.
Location
San Francisco, CA
ACS Topics Used
Race, age, income, educational attainment, health insurance coverage, employment status
Page Last Revised - May 14, 2024
✕
Is this page helpful?
 Yes
Yes
 No
No
 Yes
Yes
 No
No✕
NO THANKS
255 characters maximum
 255 characters maximum reached
✕
Thank you for your feedback.
Comments or suggestions?

Comments or suggestions?