
Official websites use .gov
A .gov website belongs to an official government organization in the United States.
Secure .gov websites use HTTPS
A lock (
) or https:// means you’ve safely connected to the .gov website. Share sensitive information only on official, secure websites.

Topics
Data & Maps
Surveys & Programs
Resource Library
Poverty Rate at 12.3 Percent, Down From 14.8 in 2014
The national poverty rate continued to decline in 2017, the third successive decline in the poverty rate, according to U.S. Census Bureau data released today.
The poverty rate dropped consistently every year from 2015 to 2017 — a total of 2.5 percentage points — to a rate of 12.3 percent in 2017.
The data come from the Current Population Survey Annual Social and Economic Supplement (CPS ASEC). This three-year run of declines in poverty reflects the longest stretch of annual declines in the poverty rate since the four-year period of 1997 to 2000.
Poverty Rates Have Fluctuated Greatly Since 1970
When the poverty measure was first established in 1959, 22.4 percent of individuals were living in poverty.
In the first 10 years of the measure, from 1959 to 1969, poverty seemed to move in one direction — downward — falling 10.3 percentage points in that 10-year period.

However, sustained, long-term progress in lowering poverty rates has been more difficult in subsequent years.
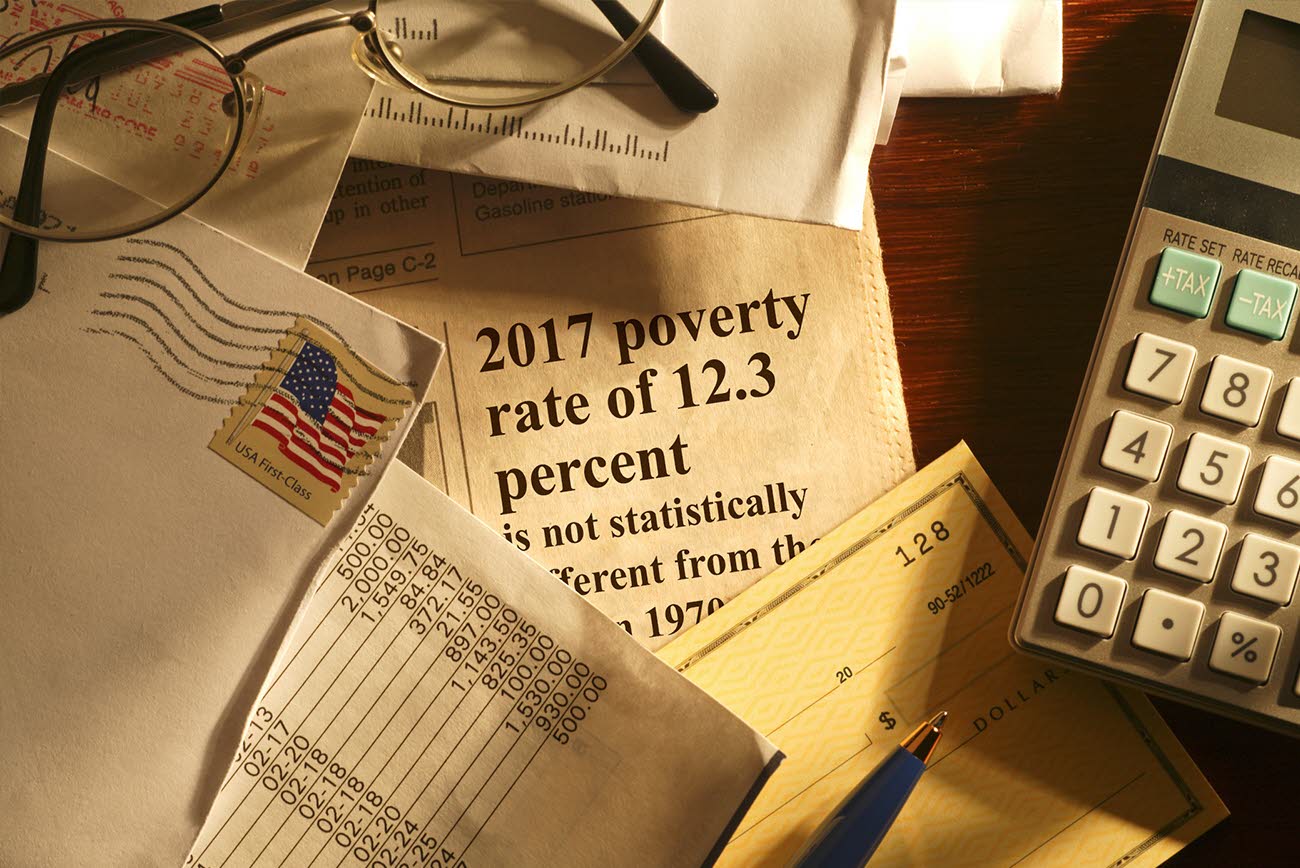
Even after recent declines, the 2017 poverty rate of 12.3 percent is not statistically different from the rate in 1970. Since 1970, the annual poverty rate has increased 14 times and decreased 17 times.
Year-to-year increases in poverty in the 14 years when the rate went up tended to be higher, an average of 0.8 percentage points. In contrast, the average annual drop in the 17 years when poverty declined was 0.6 percentage points.
Ashley Edwards is Chief of the Poverty Statistics Branch at the U.S. Census Bureau.
Income and Poverty Video
America Counts Story
Highest Median Household Income on Record?
What looks like a record high may be due to redesigned income questions. Taking the change into account shows no difference from previous highs.
America Counts Story
Who Are the Uninsured?
The number of people without health insurance grew to 28 million in 2017, up from 27.3 million the previous year.
America Counts Story
Nutrition Assistance Program Lifts 3.4 Million Out of Poverty
The Supplemental Poverty Measure (SPM) allows the Census Bureau to see how different government programs – like SNAP – impact the number...
Page Last Revised - October 8, 2021
✕
Is this page helpful?
 Yes
Yes
 No
No
 Yes
Yes
 No
No✕
NO THANKS
255 characters maximum
 255 characters maximum reached
✕
Thank you for your feedback.
Comments or suggestions?

Comments or suggestions?