
Official websites use .gov
A .gov website belongs to an official government organization in the United States.
Secure .gov websites use HTTPS
A lock (
) or https:// means you’ve safely connected to the .gov website. Share sensitive information only on official, secure websites.

Topics
Data & Maps
Surveys & Programs
Resource Library
Supplemental Poverty Measure Shows Who Benefits From Government Programs
An alternative to the official poverty measure, the Supplemental Poverty Measure (SPM) incorporates the value of noncash government transfers, taxes, and necessary expenses into the resources a family has available to meet their basic needs.
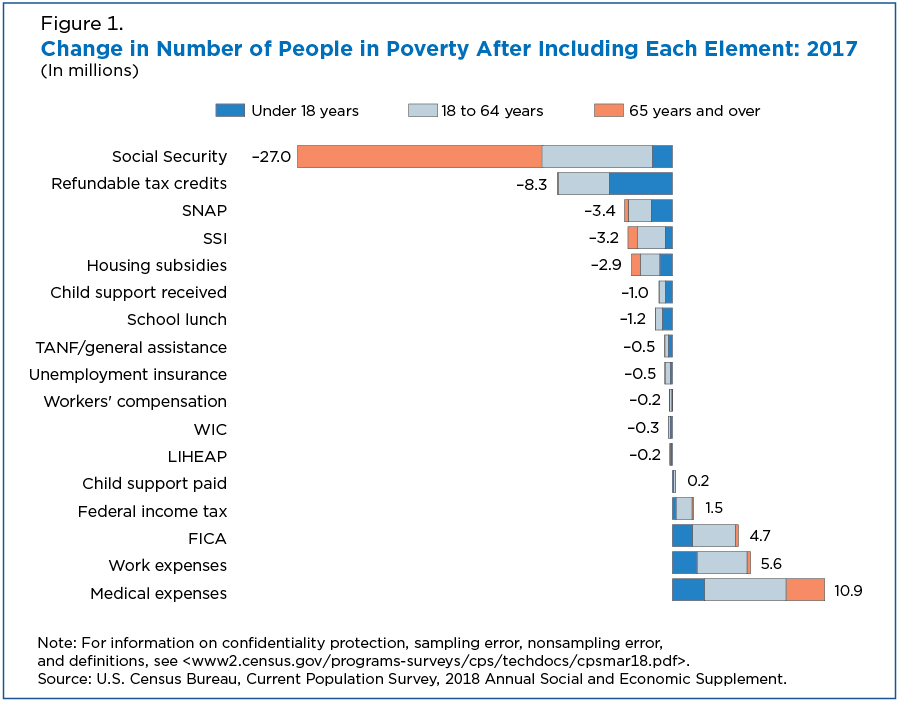
Figure 8 in the 2017 SPM Report, released today, shows how each element impacts the number of people in poverty.
The Supplemental Nutrition Assistance Program (SNAP) lifted 3.4 million people (1.1 percent) in the United States, including 1.5 million children (2.0 percent), out of poverty in 2017.
The Supplemental Nutrition Assistance Program (SNAP) lifted 3.4 million people (1.1 percent) in the United States, including 1.5 million children (2.0 percent), out of poverty in 2017.
As one of the largest noncash anti-poverty programs in the United States, SNAP plays a crucial role in providing nutritional assistance to some of the most vulnerable members of society.
Not All SNAP Recipients Are Lifted Out of Poverty
SNAP provides benefits to millions of people who are living both above and below the SPM poverty threshold (not just at the margin of the threshold).
Based on analysis of the 2018 Current Population Survey Annual Social and Economic Supplement (CPS ASEC), 33.3 million individuals lived in a SPM unit that reported receiving SNAP benefits. Of these recipients, 12.6 million people (38 percent) had resources below 100 percent of their poverty threshold, even after including the value of their SNAP benefits.
Income-to-poverty ratios represent the ratio of a SPM unit’s income to their applicable SPM poverty threshold.
Ratios below 1.00 indicate that the income for the unit is below the definition of SPM poverty, while a ratio of 1.00 or greater indicates income above the poverty level. A ratio of 0.50, for example, indicates that income was 50 percent below the applicable SPM poverty threshold.
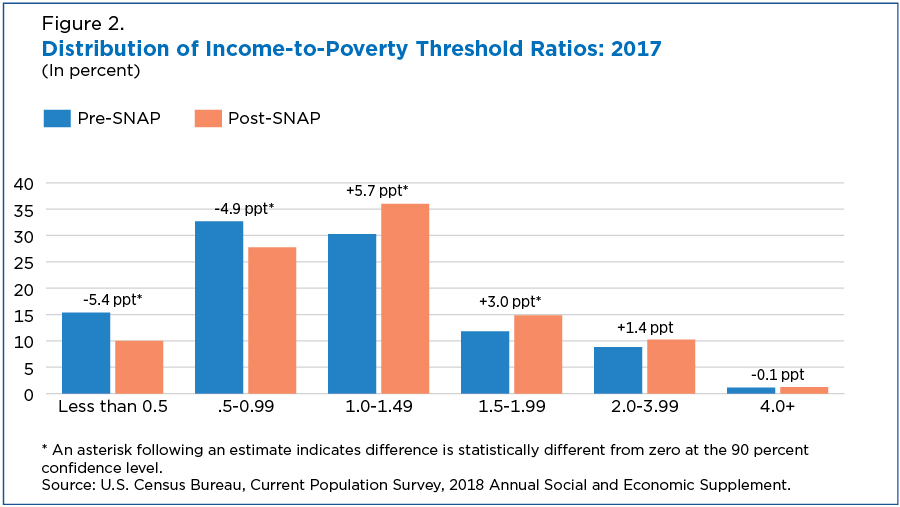
The figure below shows the distribution of income-to-poverty ratio categories estimated without the inclusion of SNAP benefits (pre-SNAP) as well as including the value of SNAP benefits in the definition of income (post-SNAP).
Including SNAP shifts the distribution of income-to-poverty ratios to the right, meaning that more individuals fall into higher income-to-poverty ratio categories in the post-SNAP distribution.
SNAP significantly reduced the proportion of people in the lowest income-to-poverty ratio category (having resources less than 50 percent of the poverty threshold) from 15.4 percent to 10 percent.
It also reduced the proportion with resources between 50 to 99 percent of the poverty threshold by 5 percentage points (from 32.7 to 27.7 percent).
Who Are SNAP Recipients?
Looking at the demographics of SNAP beneficiaries, the vast majority (81 percent or 27.0 million) were either children, older people age 65 or older, ill or disabled individuals, or adults working at least 20 hours per week. Each of these demographic categories are mutually exclusive.
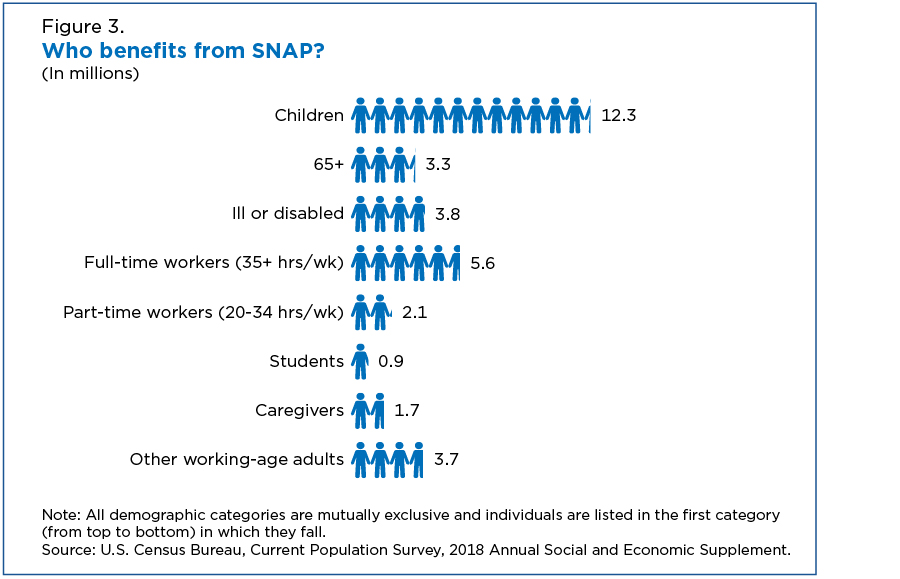
An additional 8 percent of SNAP beneficiaries were students or reported being unable to work due to caregiving responsibilities. About 11 percent (3.7 million people) were nondisabled, working-age adults who worked less than 20 hours a week.
This analysis provides a brief snapshot into the impact of SNAP benefits on the poverty status of recipients and the demographic composition of the individuals who benefit from the program.
Liana Fox and Laryssa Mykyta are Statisticians in the Supplemental Poverty Measure research area of the Social, Economic and Housing Statistics Division at the Census Bureau.
Supplemental Poverty Measure Video
America Counts Story
Highest Median Household Income on Record?
What looks like a record high may be due to redesigned income questions. Taking the change into account shows no difference from previous highs.
America Counts Story
Poverty Rate Drops for Third Consecutive Year in 2017
The three-year run of declines in poverty is the longest stretch of annual declines since 1997-2000, but the struggle to sustain...
America Counts Story
Who Are the Uninsured?
The number of people without health insurance grew to 28 million in 2017, up from 27.3 million the previous year.
Page Last Revised - October 8, 2021
✕
Is this page helpful?
 Yes
Yes
 No
No
 Yes
Yes
 No
No✕
NO THANKS
255 characters maximum
 255 characters maximum reached
✕
Thank you for your feedback.
Comments or suggestions?

Comments or suggestions?