Disability Rates Highest Among American Indian and Alaska Native Children and Children Living in Poverty
The childhood disability rate in the United States was higher in 2019 than in 2008 and rates were highest among American Indian and Alaska Native children and those living in poverty, according to a new U.S. Census Bureau brief.
Childhood Disability in the United States: 2019 examines rates of disability among U.S. children under age 18 using the 2019 American Community Survey (ACS) — the most recent data available — and the 2008 ACS, which first included the current set of disability questions.
Over three million children (4.3% of the under-18 population) in the United States had a disability in 2019, up 0.4 percentage points since 2008.
According to the ACS, people are considered to have a disability if they have difficulty with one or more of the following activities:
- Seeing.
- Hearing.
- Concentrating or remembering (ages 5 and above).
- Walking or climbing stairs (ages 5 and above).
- Dressing or bathing (ages 5 and above).
- Doing errands alone such as buying groceries or going to the doctor (ages 15 and above).
Based on this measure, over three million children (4.3% of the under-18 population) in the United States had a disability in 2019, up 0.4 percentage points since 2008.
The most common disability type among children both years was cognitive difficulty, which saw one of the largest jumps in prevalence between 2008 and 2019.
The data show some children and households were more likely to experience childhood disability than others.
Racial Differences
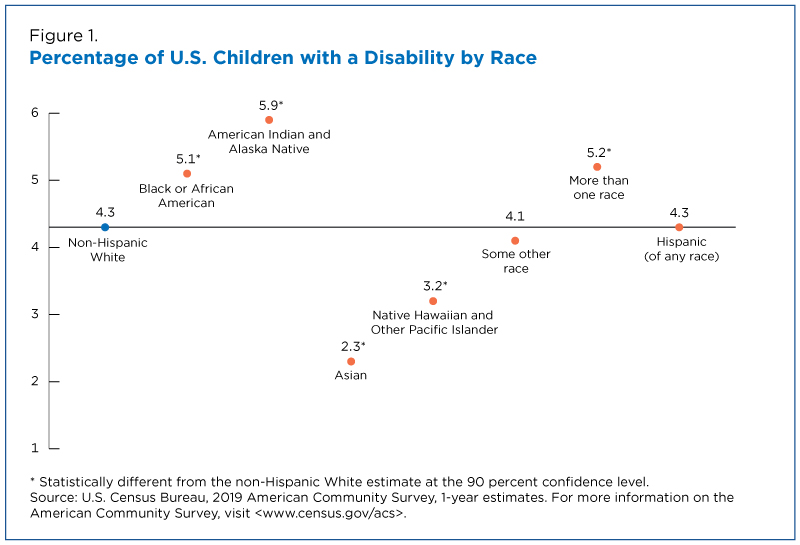
American Indian and Alaska Native (AIAN) children had the highest rate of childhood disability of all racial groups, at 5.9% in 2019.
Children of more than one race (5.2%) and Black children (5.1%) had the next highest rates (disability rates for Black children and children of more than one race did not significantly differ from each other).
Non-Hispanic White children (4.3%) had a lower disability rate than American Indian and Alaska Native children, Black children, and children of more than one race, but a higher rate than Asian children (2.3%) and Native Hawaiian and Other Pacific Islander (NHPI) children (3.2%). The disability rate among Hispanic children did not differ from the rate among non-Hispanic White children (Figure 1).
Differences in childhood disability rates across race and Hispanic origin groups may reflect differences in socioeconomic characteristics.
For example, American Indian and Alaska Native households have the nation’s second lowest median income and a higher percentage of American Indian and Alaska Native families live in poverty, compared to other racial groups.
American Indian and Alaska Native families are also more likely to live in rural areas, where access to maternal care and other services important for infant and child development may be limited compared with other areas of the country.
Disability and Poverty
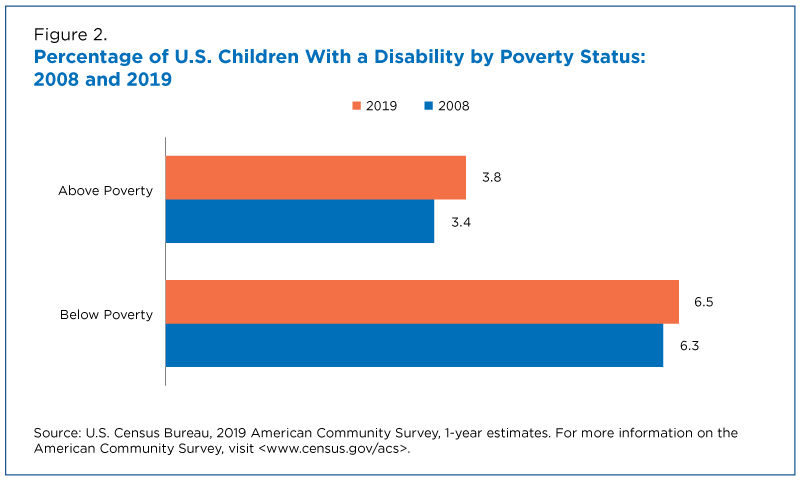
In 2019, children living in poverty were more likely to have a disability (6.5%) than children living above the poverty threshold (3.8%).
The difference in the prevalence of disability between children below and above the poverty threshold is noteworthy. Families in poverty tend to have fewer financial resources to care for a child with a disability.
Children with disabilities may have additional needs that prevent one or more family members from participating in the workforce. This can create financial strain for families, and in some cases may contribute to a family’s entry into poverty.
Disability rates were significantly higher in 2019 than in 2008 for both children in poverty and those not in poverty (Figure 2). However, the percentage point increase was greater for children above the poverty threshold.
This increase in disability prevalence among children in families above the poverty threshold does not necessarily mean that children in this group had a higher risk of disability in 2019 than in 2008. It may stem from changes in access to health care and diagnosis among members of this group.
Changes in public awareness and diagnosis of disability in the United States also may have contributed to the overall increase in the childhood disability rate between 2008 and 2019.
These trends, as well as differences in resources available to families to care for children with a disability, pose unique challenges to interpreting U.S. disability patterns.
Natalie A. E. Young and Katrina Crankshaw are survey statisticians in the Census Bureau’s Health and Disability Statistics Branch.


