The South Had Highest Disability Rate Among Regions in 2021
Where people live may impact their ability to access health care services and for those with disabilities or who require specialized care that entails more frequent attention and medical visits, location can play an even more significant role.
It is important to understand how regional and urban/rural differences in disability contribute to the unique challenge of addressing health disparities in the United States. Identifying where people with disabilities are concentrated can help inform where there may be shortages of specialized providers or limited transportation options.
Examining disability rates across geography reveals notable differences between urban and rural areas, and regions.
In 2021, nearly 42.5 million people (13%) among the civilian noninstitutionalized population in the United States had a disability, according to the American Community Survey (ACS) 1-year estimates.
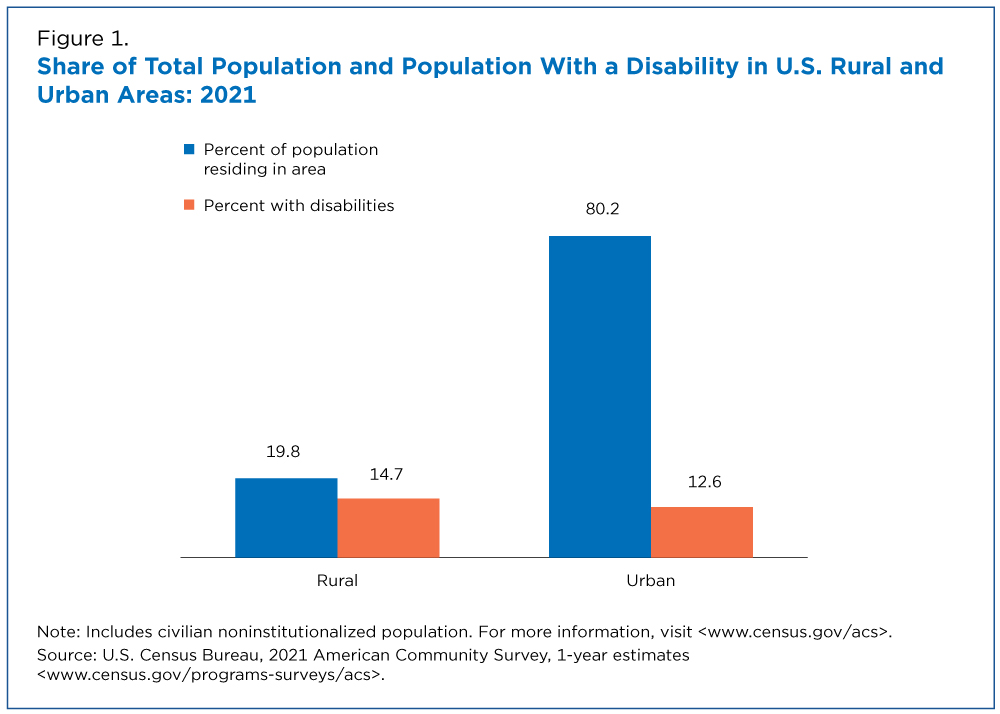
Rural residents — less than 20% of the U.S. population — were more likely (14.7%) than their urban counterparts to experience disability.
The ACS considers people to have a disability if they have difficulty with one or more of the following:
- Seeing.
- Hearing.
- Concentrating or remembering (ages 5 and above).
- Walking or climbing stairs (ages 5 and above).
- Dressing or bathing (ages 5 and above).
- Doing errands alone such as buying groceries or going to the doctor (ages 15 and above).
Urban/Rural Differences in Disability
In 2021, the U.S. population was primarily urban, with 80.2% living in urban areas; 12.6% of them reported a disability in 2021.
Rural residents — less than 20% of the U.S. population — were more likely (14.7%) than their urban counterparts to experience disability.
Rural communities may be more geographically isolated and typically have more limited transportation and access to clinics and hospitals than urban areas. As a result, coordination of care for those with disabilities may be more difficult for rural residents due to these geographic and transportation barriers.
Regional Differences in Disability
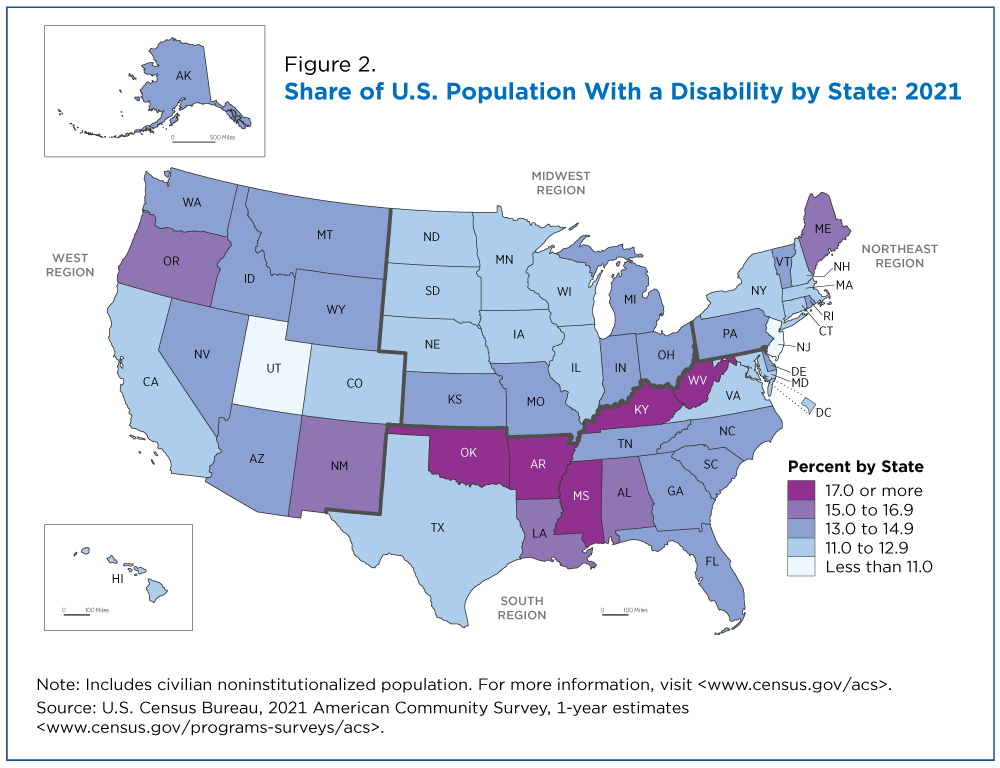
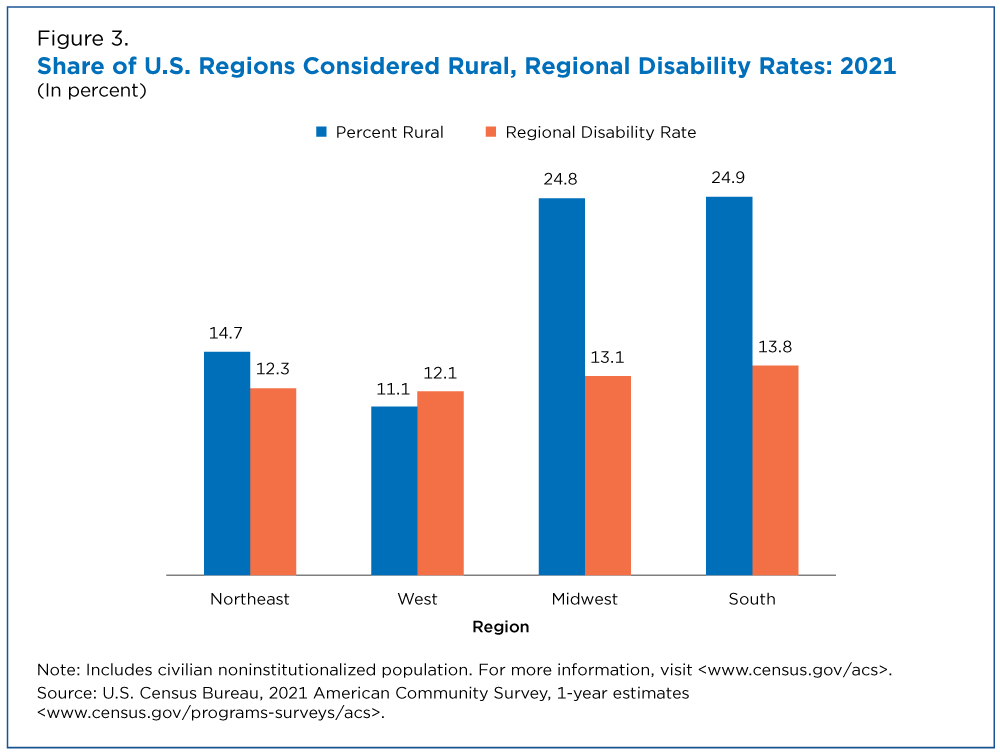
In 2021, the South had the nation’s highest rates of disability (13.8%), followed by the Midwest (13.1%), the Northeast (12.3%), and the West (12.1%) (Figure 2).
Regional disability rates may differ for a variety of reasons. For example, disability is often associated with age, so regions that contain states with a higher proportion of the population age 65 and over may be more likely to report higher rates of disability.
Many states in the South are part of what is known as the Stroke Belt, defined by the National Heart Lung and Blood Institute as a cluster of states (including Alabama, Arkansas, Georgia, Indiana, Kentucky, Louisiana, Mississippi, North Carolina, South Carolina, Tennessee and Virginia) that have a higher incidence of stroke than the rest of the country.
Stroke is one of the nation’s primary causes of long-term disability, and half of stroke survivors age 65 years and older experience reduced mobility as a result. The higher stroke incidence is just one factor that may contribute to the southern region’s overall higher disability rates.
Age Differences in Disability
Geographic disparities in disability rates may reflect differences in the age distribution of the population in urban and rural areas and across regions. Rural areas had an older population than urban areas in 2021: 19.9% of rural residents were age 65 and older, compared with 16.0% of urban residents.
Differences in age composition do not always explain regional disparities in disability rates. Although the South had the highest disability rate in 2021, for example, the share of the population age 65 and older was no higher in the South (16.6%) than in the Northeast (17.7%) and the Midwest (17.1%).
This suggests additional factors contribute to differences in regional disability rates.
Regional Differences in Rurality and Disability
Disability rates on average were higher in rural areas than in urban areas, which may provide insight into differences in disability by region.
Regions with more rural residents were expected to have higher disability rates since people living in rural areas had higher disability rates than those in urban areas.
The two regions with the highest disability rate in 2021 — the South and the Midwest — also had the highest percentages of people living in rural areas (24.9% and 24.8%, respectively). The West, where disability rates were the lowest in 2021, had the lowest share (11.1%) of people living in rural areas.
Urban/Rural Disability Divide Within Regions
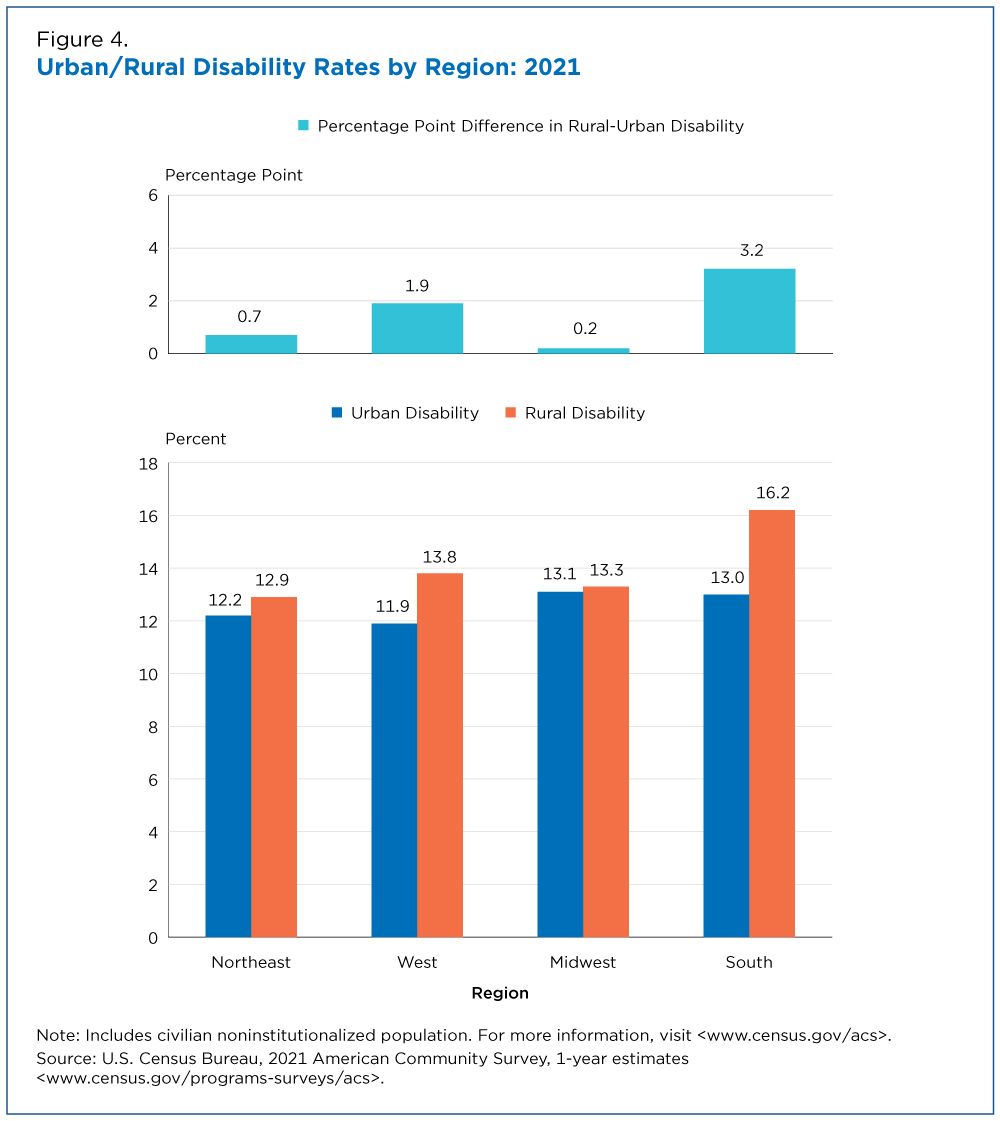
In all regions, the rural population had higher disability rates than the urban population (Figure 4). Rural-urban differences in disability rates were largest in the South (3.2 percentage points), followed by the West (1.9 percentage points). The Midwest had the smallest urban/rural difference in disability rates (0.2 percentage points).
Although the South and the Midwest had the nation’s highest overall disability rates in 2021, the South had the largest differences in disability rates by urban/rural residence and the Midwest had the smallest urban/rural differences in disability rates.
Related Statistics
Stats for Stories
Stats for Stories
Subscribe
Our email newsletter is sent out on the day we publish a story. Get an alert directly in your inbox to read, share and blog about our newest stories.
Contact our Public Information Office for media inquiries or interviews.


