
Official websites use .gov
A .gov website belongs to an official government organization in the United States.
Secure .gov websites use HTTPS
A lock (
) or https:// means you’ve safely connected to the .gov website. Share sensitive information only on official, secure websites.

Topics
Data & Maps
Surveys & Programs
Resource Library
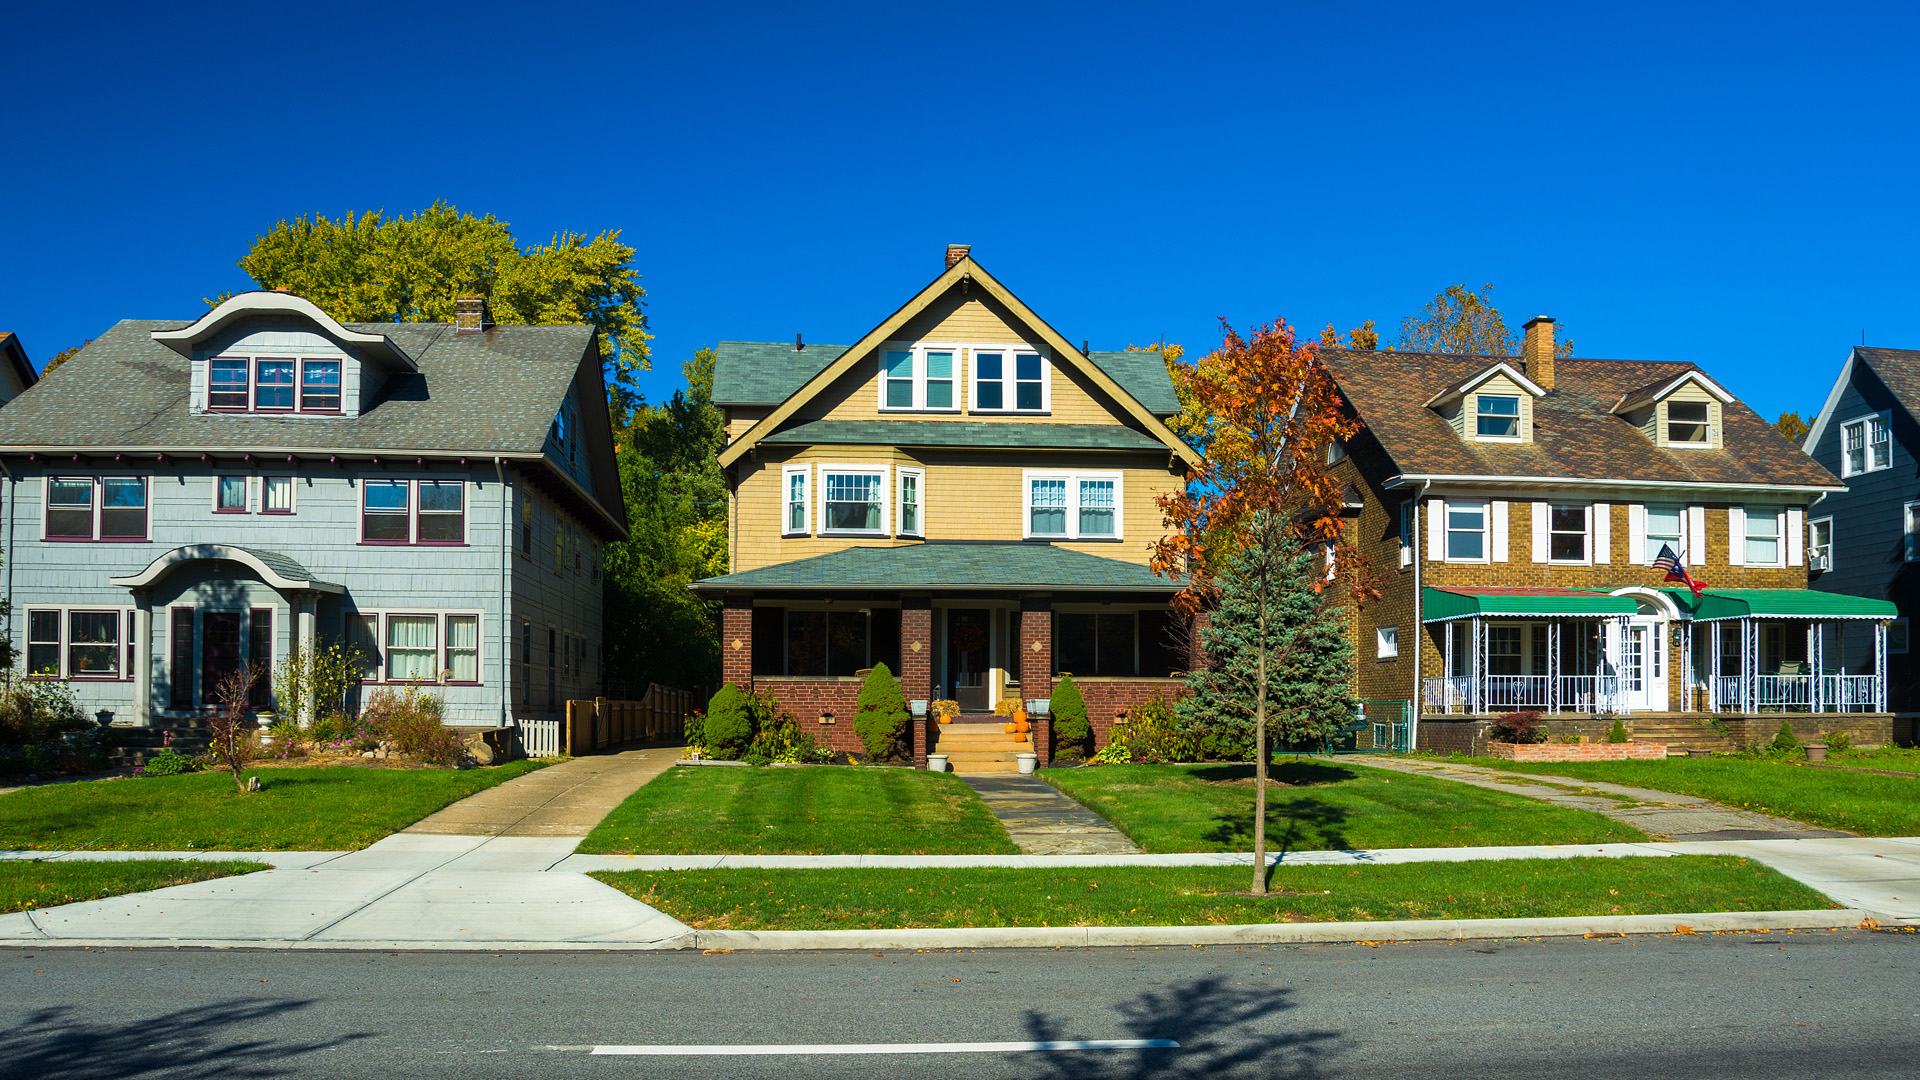
From Size of Homes to Rental Costs, Census Data Provide Economic and Lifestyle Profile of U.S. Housing
Want to find a place to rent quickly? Move to the South or Midwest, regions that have the highest rental vacancies in the nation.
That could be because those regions have the highest U.S. homeownership rates, according to the U.S. Census Bureau’s Housing Vacancies and Homeownership data, which provide current information on rental and homeowner vacancy rates and characteristics of units available for occupancy by region. Public and private sector organizations use these economic indicators to evaluate the need for new housing programs and initiatives.
A bigger share of homeowners (41.6%) than renters (28.7%) had a bachelor’s degree or higher. They also earned more money: median annual household income was $78,000 compared to renters’ $41,000.
Whether you’re a renter or homeowner, housing is in the spotlight as we observe American Housing Month and National Homeownership Month celebrating the value of homeownership and ways banks and other institutions can help people reach their housing goals.
Census Bureau surveys help complete the U.S. housing picture by viewing it through an economic and lifestyle lens.
Rent or Buy? You Choose
According to Home Vacancies and Homeownership data, the Midwest had the nation’s highest homeownership rate (70.3%) in the first quarter of 2023, followed by the South (67.3%), Northeast (62.7%) and West (61.9%).
Homeownership is defined as the proportion of households that are owners.
The homeownership rates, compared to the first quarter 2022, were higher in the West and not statistically different in the Northeast, Midwest, and South.

Rental vacancy rates were higher in the South (8.3%) and Midwest (7.5%) than in the West (4.3%) and Northeast (4.1%). There was no statistical difference between the rates in the South and Midwest or between the West and Northeast.
The rates in the Midwest and South were higher and the rate in the Northeast lower than a year earlier; the rate in the West was not statistically different from first quarter 2022.

Who Owns and Who Rents?
The 2021 American Housing Survey provides a demographic profile of owners and renters and the types of housing and neighborhoods they choose.
Most U.S. owners:
- Had a home that was a detached, one-unit building (84.3%).
- Believed their neighborhood had good schools (92.7%).
Of the 5,380,000 U.S. homeowners planning to move in the next 12 months, 38.3% said they planned to move to a different city.
Most renters:
- Had a home in a building with two or more apartments (61.5%).
- Believed their neighborhood has good public transportation services (61.0%) and schools (89.3%).
Of the 14,375,000 renters planning to move in the next 12 months, 39.3% said they planned to move to a different neighborhood in the same city.
A bigger share of homeowners (41.6%) than renters (28.7%) had a bachelor’s degree or higher. They also earned more money: median annual household income was $78,000 compared to renters’ $41,000.

New Homes Sales
How much do new homes cost?
The New Residential Sales (NRS) economic indicator includes estimates of new homes sold, median and average sales prices, median months for sale since completion, months’ supply and inventories of homes built for sale.
According to the NRS, there were 763,000 sales (based on the seasonally adjusted annual rate) of new, single‐family houses in May. That’s 12.2% (±12.8%) more than the revised April rate of 680,000 and 20.0% (±15.5%) more than the May 2022 sales (636,000). The average sales price for May 2023: $487,300.

What Do New Homes Look Like?
How big, how many bedrooms and bathrooms and what kind of heating fuel new homes use can all be found in the Census Bureau’s Characteristics of New Housing, which provides national and regional annual data on the characteristics of new privately-owned residential structures.

Of the 1,022,000 new single-family homes completed in 2022:
- 994,000 had central air-conditioning.
- 92,000 had two bedrooms or less and 490,000 had four bedrooms or more.
- 33,000 had one and one-half bathrooms or less and 362,000 had three or more bathrooms.
- 440,000 had a heat pump. Of these, 435,000 were air-source and 5,000 were ground-source.
- 956,000 were framed in wood and 63,000 were framed using concrete.
- 370,000 had a patio and a porch, while 75,000 had no outdoor features.
- The median size of a completed single-family home was 2,299 square feet.
Home Improvements and Repair
For those not in the new-home market, the answer may be home improvement. The American Housing Survey (AHS) has up-to-date information about housing conditions and improvement costs in the United States and major metropolitan areas.

In 2021:
- U.S. homeowners spent a median of $5,000 on home improvements, including heating, ventilation and air conditioning or HVAC ($4,200); kitchen remodeling ($6,000); floor/panel/ceiling tiles ($2,000); bathroom remodeling ($3,500); and doors/windows ($1,900).
- 49.0 million (59%) homeowners made home improvements.
- 53.0 million (39%) of the 135.0 million home projects were do-it-yourself.
- There were 504,000 repairs made to owner-occupied housing units damaged by tornados and hurricanes and 156,000 to those damaged by fire.

Many of the nation’s 128.5 million occupied housing units needed repairs in 2021:
- 11.4 million reported water leakage from outside their home.
- 7.2 million had open cracks or holes inside their home.
- 5 million had crumbling or an open crack or hole in their foundation.
- 3.8 million reported mold in their homes in the previous 12 months.
- 2.5 million had no working toilet at some point during the last three months.
- 15.3 million saw signs of mice/rats inside the home in the last 12 months.
- 14.5 million saw signs of cockroaches inside the home in the last 12 months.
The AHS Table Creator allows access to data for selected state and metro areas.
Economic Impact of Housing and Homeownership
Activities related to housing and homeownership cross almost all industry sectors.

The Census Bureau’s Annual Survey of Manufactures (ASM) provides the value of shipments and employment for select manufacturing industries that make housing-related products. Hover over the “dots” to find the value of shipments or employment data. Estimated 2021 value of shipments from these industries include:
- Major Household Appliance Manufacturing – $24.2 billion.
- Wood Window and Door Manufacturing – $16.0 billion.
- Upholstered Household Furniture Manufacturing – $12.3 billion.

Whether you rent or own, furniture and appliances are necessities. The Annual Retail Trade Survey (ARTS) provides national estimates of total annual sales, e-commerce sales, end-of-year inventories, purchases, total operating expenses and sales taxes for U.S. retail businesses. Estimated sales for select housing-related industries in 2021 include:
- Furniture and home furnishings stores – $140.6 billion.
- Electronics and appliance stores – $93.5 billion.
- Building materials and supplies dealers – $417.0 billion.
The Annual Wholesale Trade Survey (AWTS) provides national estimates of total annual sales, e-commerce sales, end-of-year inventories, purchases, total operating expenses, gross margins, and commissions (for electronic markets, agents, and brokers) for U.S. wholesale businesses. 2021 sales estimates from this survey include:
- Furniture and Home Furnishing Merchant Wholesalers – $135.5 billion.
- Lumber and Other Construction Materials Merchant Wholesalers – $278.4 billion.
- Hardware, and Plumbing and Heating Equipment and Supplies Merchant Wholesalers – $251.4 billion.
The Service Annual Survey (SAS) provides annual nationwide estimates of revenue, expenses and other measures for most traditional service industries. Estimated revenue for employer firms for select housing-related industries for 2021 include:
- Offices of Real Estate Agents and Brokers – $180.0 billion.
- Consumer Electronics and Appliances Rental – $10.3 billion.
- Home and Garden Equipment and Appliance Repair and Maintenance – $4.0 billion.
Stats for Stories provides additional resources for accessing other housing-related data available from the Census Bureau.
The Census Bureau will provide more info at its Exploring Census Data: Housing and Real Estate webinar scheduled for June 29.
Note
Differences between estimates may be attributed to sampling or nonsampling error rather than to differences in underlying economic conditions. Use caution drawing conclusions from the estimates and comparisons shown.
The U.S. Census Bureau has reviewed these data products to ensure appropriate access, use, and disclosure avoidance protection of the confidential source data.
Subscribe
Our email newsletter is sent out on the day we publish a story. Get an alert directly in your inbox to read, share and blog about our newest stories.
Contact our Public Information Office for media inquiries or interviews.
Housing
Housing Costs a Big Burden on Renters in Largest U.S. Counties
New U.S. Census Bureau data show that renters are more likely than homeowners to spend more than 30% of their income on housing costs.
Housing
Housing Vacancy Rates Near Historic Lows
Housing Vacancy Survey shows that availability of homeowner and rental housing tightened during the COVID-19 pandemic.
Housing
See a Vacant Home? It May Not be For Sale or Rent
The largest category of vacant housing is seasonal housing, from beachfront homes to part-time residences.
More stories
Population
Who Commuted on Baltimore’s Key Bridge?
Francis Scott Key Bridge commuters had long, early commutes and were concentrated in specific earnings and occupational categories.
Income and Poverty
Fresh Insights on Income Mobility From 2005 to 2019
Mobility, Opportunity, and Volatility Statistics (MOVS) project shows income dynamics of working-age adults across socio-economic and geographic groups.
Business and Economy
Small Business Week 2024: How Small Businesses Impact Our Economy
The 61st Annual Small Business Week theme is “Building on the Small Business Boom.”
Education
Largest Annual Spike in Public School Spending in Over 20 Years
The Annual Survey of School System Finances shows per pupil spending and revenues for nation’s public school districts in FY 2022.
Page Last Revised - June 29, 2023
✕
Is this page helpful?
 Yes
Yes
 No
No
 Yes
Yes
 No
No✕
NO THANKS
255 characters maximum
 255 characters maximum reached
✕
Thank you for your feedback.
Comments or suggestions?

Comments or suggestions?