Surveying U.S. Census Bureau Commuting Data in Atlanta
Surveying U.S. Census Bureau Commuting Data in Atlanta
Today, I am in Atlanta for a roundtable discussion with local officials on commuting data, and discussing how they can use the Census Bureau’s wealth of statistics to serve their communities.
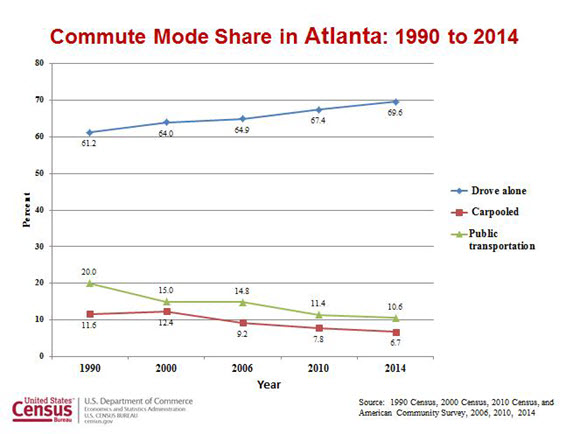
The Atlanta area is a great case study of some of the many ways that commuting data can be used by policy makers and residents. For starters, our data show that the mean travel time of Atlanta-area commuters is among the highest of American metro areas, at 31 minutes. Our data also indicate how residents get to work – whether by car, bike, public transportation or on foot. Atlantans rely heavily on their cars, with 76.3 percent of workers commuting by automobile.
Commuting data can also tell Atlanta leaders about how residents use other modes of transportation, such as the MARTA bus and rail line, the Downtown Loop streetcar line that opened in 2014, and the multi-use BeltLine trail that’s currently under development. Our statistics can show changes in how people use these alternative travel methods over time.
Armed with Census Bureau data on commuting, local officials can see how, when, and where their residents are commuting. This enables them to make evidence-based decisions on transportation on behalf of their constituents. For example, they can examine the relationship between transportation systems and development patterns in their area; implement policies to address traffic congestion; and use forecasting to predict commuting behavior.
But officials aren’t the only people who can use our data. Residents and advocacy groups can use them to petition for new or expanded roads, bus lines, bike lanes, and sidewalks. Entrepreneurs and economic development agencies can better understand the link between travel and business patterns. And the Centers for Disease Control and Prevention (coincidentally, based in Atlanta) uses commuting data to track community design and its effect on environmental public health. The potential uses are endless.
Census Bureau commuting statistics come from the American Community Survey, the largest household survey in the U.S. Along with data on commuting patterns, the American Community Survey provides statistics on housing, employment, education and many other topics – and it’s the basis for the distribution of more than $400 billion in federal funds. Transportation strategy is just one way that communities use American Community Survey statistics to plan for investments and services.
Director Thompson and Doug Hooker, Atlanta Regional Commission executive director, discuss how Census Bureau data can be used to inform decisions on the city’s commuting and transportation needs.
If you’re interested in learning more about commuting patterns in your community, check out Census Explorer: Commuting Edition to see data by state, county and neighborhood. For special reports on commuting, visit the Census Bureau’s commuting web page.


