Poverty Rates by State: Does the Measure Matter?
Poverty Rates by State: Does the Measure Matter?
In November 2011, the Census Bureau, with support from the Bureau of Labor Statistics, released the first set of estimates for the research supplemental poverty measure as suggested by an interagency technical working group. Today, the Census Bureau releases the second report describing research on the new supplemental poverty measure.
New in this report is a comparison of official poverty rates by state to estimates using the supplemental measure. The new measure creates a more complex statistical picture incorporating additional items, such as thresholds that vary geographically by housing costs, tax payments, work expenses and in-kind benefits in its family resource estimates. The supplemental measure is designed to provide a further understanding of economic conditions and trends for families and individuals.
Again, this is the first year state-level supplemental poverty estimates are available. The Census Bureau recommends the use of three-year averages to compare poverty rates across states using the Current Population Survey Annual Social and Economic Supplement.(This is also the first year for which three years of supplemental poverty estimates are available to make the comparison with the official rates.) The three-year-average poverty rates for the U.S. for 2009-2011 were 15.0 percent with the official measure and 15.8 percent using the supplemental measure.
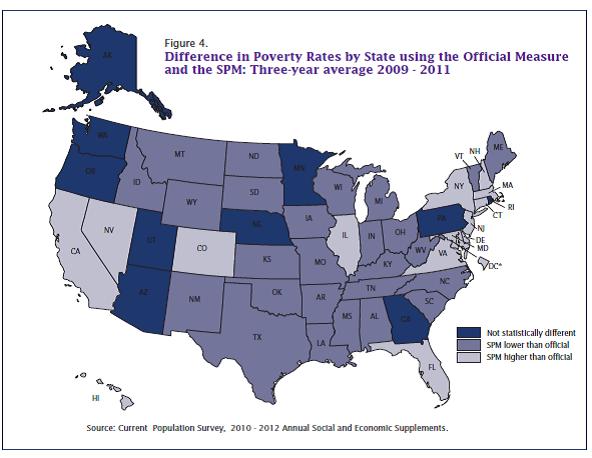
The map below shows the United States divided into three categories by state: states with higher and lower rates with the supplemental measure compared with the official measure, and states that are not statistically different between the two measures.
Higher supplemental poverty rates by state may occur because of many sources: geographic adjustments for housing costs, a different mix of housing tenure or metropolitan area status, or higher nondiscretionary expenses, such as taxes or medical expenses.
The supplemental poverty rates for the District of Columbia and 14 states are higher than the official poverty rates, as noted by the lighter shades. These states are California, Colorado, Connecticut, Delaware, the District of Columbia, Florida, Hawaii, Illinois, Maryland, Massachusetts, Nevada, New Hampshire, New Jersey, New York and Virginia.
Medium shades represent the 26 states where supplemental poverty rates are lower than the official poverty rates. These states are Alabama, Arkansas, Idaho, Indiana, Iowa, Kansas, Kentucky, Louisiana, Maine, Michigan, Mississippi, Missouri, Montana, New Mexico, North Carolina, North Dakota, Ohio, Oklahoma, South Carolina, South Dakota, Tennessee, Texas, Vermont, West Virginia, Wisconsin, and Wyoming.
Lower supplemental poverty rates occur because of lower thresholds reflecting lower housing costs, a different mix of housing tenure or metropolitan area status, or more generous noncash benefits.
Darker shades are those 10 states that are not statistically different under the two measures and include Alaska, Arizona, Georgia, Minnesota, Nebraska, Oregon, Pennsylvania, Rhode Island, Utah and Washington.
The interagency technical working group stated that the official poverty measure, as defined in Office of Management and Budget Statistical Policy Directive No. 14, will not be replaced by the supplemental poverty measure. It noted that the official measure is sometimes identified in legislation regarding program eligibility and funding distribution, while the supplemental measure will not be used in this way. The supplemental measure is designed to provide information on aggregate levels of economic need at a national level or within large subpopulations or areas and, as such, the supplemental measure will be an additional macroeconomic statistic providing further understanding of economic conditions and trends for families and individuals.