Women Responsible for the Increasing Number of "Vetrepreneurs"
Women Responsible for the Increasing Number of "Vetrepreneurs"
After serving their country, millions of military veterans contribute to the nation in another, important way: as entrepreneurs. Between 2007 and 2012, the ranks of veteran-owned businesses rose by 74,074, or 3.0 percent, to reach 2.5 million.
Women were solely responsible for this overall increase in the number of veteran-owned firms. In a span of only five years, the number of female veteran-owned firms approximately quadrupled, from 97,114, or 4.0 percent of all veteran-owned firms, to 383,302, or 15.2 percent. While the number of female veteran-owned businesses was rising, the number of male veteran-owned firms was falling, from 2.3 million to 2.1 million.
There were also a relatively small number of firms that were jointly owned by veteran men and women. They declined from 29,593 to 13,714 over the period.
Furthermore, veteran-owned businesses comprised nearly 1 in 10 of all businesses. In contrast, the total number of all U.S. firms increased only 2.0 percent during the same period, from 27.1 million to 27.6 million.
These business statistics come from the 2012 Survey of Business Owners, which provides a broad socio-economic picture of business owners across the nation, and is part of the U.S. Census Bureau’s five‑year economic census, conducted for years ending in 2 and 7.
We also see that like businesses as a whole, veteran-owned businesses increasingly do not have paid employees. For instance, they may run a “mom and pop” corner store or be real estate agents or bloggers. For veteran-owned businesses, the number who did not have paid employees climbed 6.3 percent from 2007 to 2012, and the number who did have them fell 9.9 percent. Consequently, the percentage of veteran-owned businesses that did not have paid employees rose from 79.9 percent to 82.5 percent. For all businesses, the corresponding increase was from 78.8 percent to 80.4 percent. Accompanying this trend, the number of people employed by a veteran-owned business declined 13.2 percent, to 5.0 million, with receipts for both employer and nonemployer veteran-owned businesses falling 6.4 percent to $1.1 billion.
Veteran-owned firms were most commonly found in the professional, scientific and technical services sector of the economy (North American Industry Classification System, or NAICS 54), with 419,666 businesses. Within this sector, large concentrations were found in accounting, tax preparation, bookkeeping and payroll services (54,344); legal services (58,224); and management, scientific and technical consulting services (96,170).
California (252,377), Texas (213,590), Florida (185,756) and New York (137,532) led all states in the number of veteran-owned businesses. The four states combined were home to about 1 in every 3 of them (31.3 percent).
Drilling down to the local level, we see that more than one-third of California’s veteran-owned businesses were in the Los Angeles metro area (92,250 or 36.6 percent), with about half of Texas’ located in either the Houston (51,017) or Dallas-Fort Worth (58,587) metros (109,604, or 51.3 percent). Furthermore, about one-third of Florida’s businesses were in the Miami-Fort Lauderdale metro area (59,817 or 32.2 percent). New York City led the 50 most populous cities with 57,216 such firms and accounted for more than 40 percent (41.6 percent) of all veteran-owned businesses in New York State. (The entire New York-Newark-Jersey City metro area, which spans parts of New York, New Jersey and Pennsylvania, led all metropolitan areas with 139,693 firms.)
Another area with a notable concentration of veteran-owned businesses is “Hampton Roads,” which has a large military presence. For instance, among the nation’s 50 most populous cities, Virginia Beach, Va., had the highest proportion of veteran-owned firms, at 15.2 percent, or 5,384 such firms in all.
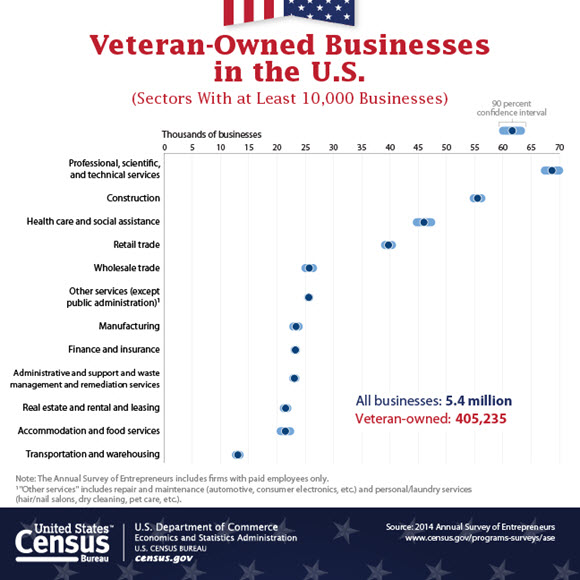
Generally, veteran-owned firms have been in business longer than other firms. Among the 405,235 veteran-owned firms with paid employees, 58.4 percent had been in business for 11 or more years, with only 6.8 percent being start-ups, in business for less than two years. The respective percentages for nonveteran-owned firms were 44.6 percent and 9.4 percent. These findings come not from the Survey of Business Owners but from the Census Bureau’s inaugural 2014 Annual Survey of Entrepreneurs, which provides a timelier, more frequent socio-economic portrait of these owners. The scope of the survey is limited to those with paid employees. It provides data on the number of years a firm has been in business so you can compare the demographic composition of new businesses to that of established ones.
These same Survey of Business Owners data (excluding statistics on years in business) are available at the more specific industry level (down to the six-digit NAICS), broken out by employer and nonemployer firms, and include additional variables, such as size of firms by receipts and employment levels.
Drawing on a sample of 1.75 million employer and nonemployer businesses, the Survey of Business Owners publishes data on the number of firms, receipts, payroll and employment, as well as the gender, ethnicity, race and veteran status of the firm owners. Geographic detail, down to the economic place, is also available. This survey is the most comprehensive source of economic data on businesses by the demographic characteristics of the owners.
The Annual Survey of Entrepreneurs collected data from a sample of approximately 290,000 employer businesses that were in operation anytime during the survey year and provides data similar to the Survey of Business Owners, but for the nation, states and metro areas and to two-digit NAICS level only. Statistics from the two surveys are not directly comparable due to methodological differences.
Come back to Random Samplings for additional blogs about these data.


