No Kids in the House: A Historical Look at Adults Living Without Children
No Kids in the House: A Historical Look at Adults Living Without Children
Over the last 50 years, the percentage of adults living without children has climbed 19 percentage points from 52.5 percent in 1967 to 71.3 percent today based on an analysis of Current Population Survey data.
The Current Population Survey holds a wealth of information on the state of American families. We know that the population is aging, and that fertility is not as high as it was some decades ago, but how does this affect the composition of the group of adults who do not live with children in their home? In this blog, we highlight the historical changes among adults who do not have children in the home using data from CPS.
A higher proportion of all adults live without children in their home now than in 1967.
Among the 64.7 million adults living without children in 1967, 59 percent shared their household with a spouse. Another 11 percent identified as an adult child of the householder, and 14 percent as living in some other arrangement, such as with a boarder or roommate. Another 14 percent lived alone and less than 1 percent lived with an unmarried partner.
By 2016, the living arrangements of adults living without children had shifted. The biggest change was a decline in the proportion living with a spouse — down to 44 percent. This decline was due to increases in the percentage living alone (20 percent) and those living with a partner (8 percent) [XLS <1.0 MB]. Another 11 percent were identified as the adult child of the householder, and 16 percent were in some other living arrangement.
The percentage of 25- to 34-year-olds with no children living with them more than doubled since 1967.
When considering changes that occurred between 1967 and 2016, keep in mind that the median age at first marriage increased from 20.6 to 27.4 for women and from 23.1 to 29.5 [XLS <1.0 MB] for men. Age at first birth increased as well [PDF 1.8 MB]. Most babies are born to a married couple [PDF 2.9 MB], so it is natural that we see shifts in the percentage of adults who live with no children when we look at particular age groups.
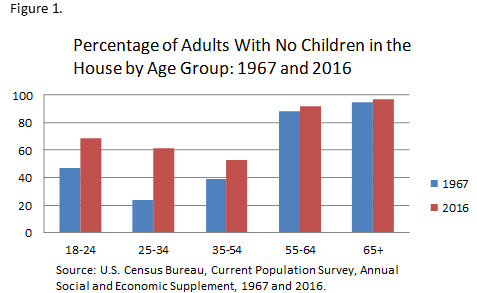
We saw the largest change in the proportion of adults living without children among those who were ages 18 to 24 and ages 25 to 34. In 1967, less than half of 18- to 24-year-olds did not have children living with them (46.7 percent) but by 2016, the majority, 68.8 percent, did not have children living with them.
We see even more dramatic changes for 25- to 34-year-olds. In 1967, 23.9 percent of 25- to 34-year-olds did not have children living with them. By 2016, the percentage of 25- to 34-year-olds without children in the home more than doubled to 61.5 percent. See Figure 1 for the percentage of all age groups living without children.
Most adults living with no children are married.
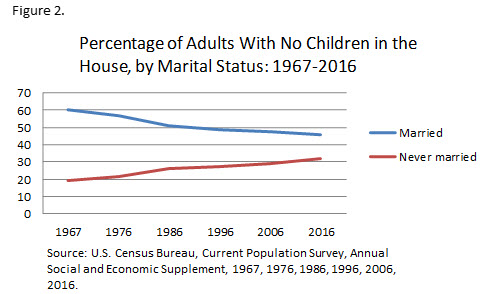
In both 1967 and 2016, a larger proportion of those who did not have children living with them were married (including married, spouse absent), compared to all other marital statuses, including never married. In 1967, 60 percent of those living without children were married and 19 percent of those living without children were never married. In 2016, 46 percent of those without children living with children were married, while 32 percent reported they had never married (See Figure 2). Conversely, if we examine only those who were never married, we find that a higher percentage in 2016 did not have children living with them, compared with 1967, 80 percent and 67 percent, respectively.
More than half of adults living without children have more than a high school degree.
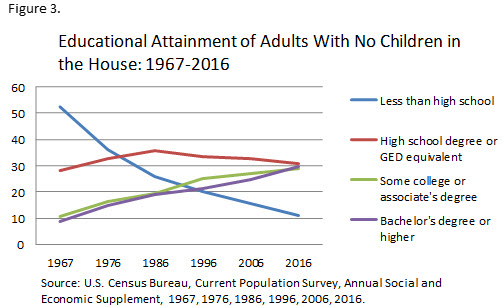
In both 1967 and 2016, the largest share of those who did not live with children had a high school degree only (28 percent in 1967, 31 percent in 2016 [see Figure 3]). This makes sense, given that younger people, who may have not yet earned a college degree, were also likely not to have had children yet. In 1967, about 20 percent of people who did not have children living with them had more than a high school degree. By 2016, that had increased to 58 percent. Overall, the share of those with at least some college education has increased over the years for all adults.
When we examine those with a college degree and whether or not they had children living with them, we see even starker changes. By 2016, 68 percent of those with a college degree did not have children living with them at the time of the interview. This is an increase from the 49 percent of college graduates in 1967.
It is important to keep in mind that these demographic changes over time only reflect changes for those who had no children living with them at the time of the interview. Further, this group is specifically identified by the lack of own children in the house. Own children are identified as biological, step or adoptive, never married children 18 years and under. These groups could have had children previously who no longer live with them, they could have gone on to have children, or they may never have had children.
Given that the total fertility rate has decreased over the years [PDF 2.9 MB] and the nation is aging, we should expect to see more Americans living without children.
For more information on the living arrangements, marital status and household composition of adults and children, please see the America’s Families and Living Arrangements table package.


