
Official websites use .gov
A .gov website belongs to an official government organization in the United States.
Secure .gov websites use HTTPS
A lock (
) or https:// means you’ve safely connected to the .gov website. Share sensitive information only on official, secure websites.

Topics
Data & Maps
Surveys & Programs
Resource Library
How Did the Pandemic Affect Survey Response: Using Administrative Data to Evaluate Nonresponse in the 2021 Current Population Survey Annual Social and Economic Supplement
How Did the Pandemic Affect Survey Response: Using Administrative Data to Evaluate Nonresponse in the 2021 Current Population Survey Annual Social and Economic Supplement
In its new report, Income and Poverty in the United States: 2020, the U.S. Census Bureau provides estimates of the distribution of household and personal income and poverty. We collected data for this report (and the accompanying microdata and summary tables) in February, March and April of each year as part of the Current Population Survey Annual Social and Economic Supplement (CPS ASEC).
The nation began shutting down in March 2020 amid the COVID-19 pandemic, slowing Current Population Survey (CPS) data collection: 73% of U.S. households responded to the basic household survey last year, about 10 percentage points lower than during the same period in 2019. As explained in a previous Research Matters blog, nonresponse bias for the 2020 CPS ASEC ranged from 2% to 4% across the income distribution, meaning income estimates from the unadjusted survey data were higher than income estimates after adjusting for nonresponse bias.1
More than a year after the coronavirus hit the United States, this blog discusses whether response rates have rebounded to prepandemic levels and the extent of nonresponse bias in 2021.
Response Rates
Figure 1 helps answer the first question by showing unweighted monthly CPS response rates from January 2010 to April 2021 along with a prepandemic trend line for comparison. During the onset of the pandemic, response rates fell sharply to 73.0% in March 2020 and 69.9% in April 2020. In March and April of this year, response rates climbed to 76.2% and 78.8%, respectively, but were still below the prepandemic trend.
Figure 1.
Unweighted Current Population Survey Monthly Response Rates: January 2010-April 2021

Source: U.S. Census Bureau, Current Population Survey, internal data files, January 2010-April 2021.
The CPS ASEC response rate is adjusted to account for those who respond to the basic survey but not to the supplement. This response rate differs from the monthly CPS response rate shown in Figure 1. The Census Bureau estimates that the unweighted combined supplement response rate was 65.0% in 2021, up from 61.1% in 2020.
Nonresponse Bias
We used administrative, 2010 Census and previous American Community Survey (ACS) data to determine whether – and how – households that did and did not respond to the CPS ASEC differed. Figure 2 shows the earnings difference between respondents and nonrespondents by the mean and select percentiles using W-2 earnings linked by address. In 2020, respondents had higher average earnings than nonrespondents across all earnings percentiles compared to previous years (2017-2019). Respondents also had higher earnings than nonrespondents earlier this year.2 Nonresponse bias in 2021 looks more like it did in 2020 than in prepandemic years.
Figure 2.
Earnings Difference Between Respondents and Nonrespondents

Source: U.S. Census Bureau, 2017-2021 Current Population Survey Annual Social and Economic Supplement linked to W-2 earnings data by address.
Still, the normal nonresponse adjustment can control for this. The Census Bureau creates weights designed to adjust for nonresponse and to target weighted counts to independent population estimates by age, sex, race and Hispanic origin. But the magnitude of the increase in (and differential nature of) nonresponse related to the pandemic likely reduced their efficacy.
We tested whether household response so far this year is still correlated with income after controlling for all the other factors in our weighting adjustment (and others that we observe in the linked data). Our findings: It is still correlated, as shown in Figure 3.3
Figure 3.
Probability of Response by W-2 Earnings

Source: U.S. Census Bureau, 2017-2021 Current Population Survey Annual Social and Economic Supplement linked to administrative and survey data.4
To understand the potential impact of nonresponse on our income statistics, we developed and implemented an alternative nonresponse adjustment. This adjustment controls for nonresponse bias using information not available in survey processing. This information includes linked administrative, census and survey data available for respondent and nonrespondent households. Since low-income households are less likely to respond, this adjustment gives more weight to lower-income respondent households than to higher-income respondent households.
Using these alternative weights, we calculate alternative income and poverty statistics and compare them against the official (survey-only) estimates. For real median household income and poverty, the estimates were not statistically different in 2017, 2018 or 2019 indicating that, in prepandemic years, the normal nonresponse adjustment in the survey weights sufficiently addressed nonresponse bias for these statistics.5
Figure 4 helps answer the second question about the extent of nonresponse bias in 2020 and 2021. It compares estimates across the income distribution to official estimates. The horizontal line at one indicates the survey and alternative-weight estimates do not differ at that point in the distribution. For 2017 to 2019, the estimates were always near 0.99 and 1. For 2020, the estimates were about 2% to 3% lower than the survey estimates, reflecting the unique pattern of nonresponse in the 2020 CPS ASEC. In 2020, median household income was 2.9% lower with the alternative weights. For this year, the estimates are 1% to 2.5% lower than the survey estimates, continuing to reflect the unique pattern of nonresponse found in the 2020 CPS ASEC. In 2021, median household income is about 2.0% lower with the alternative weights.6
Figure 4.
Comparison of Nonresponse-Adjusted Income to Survey-Only Income Over Time
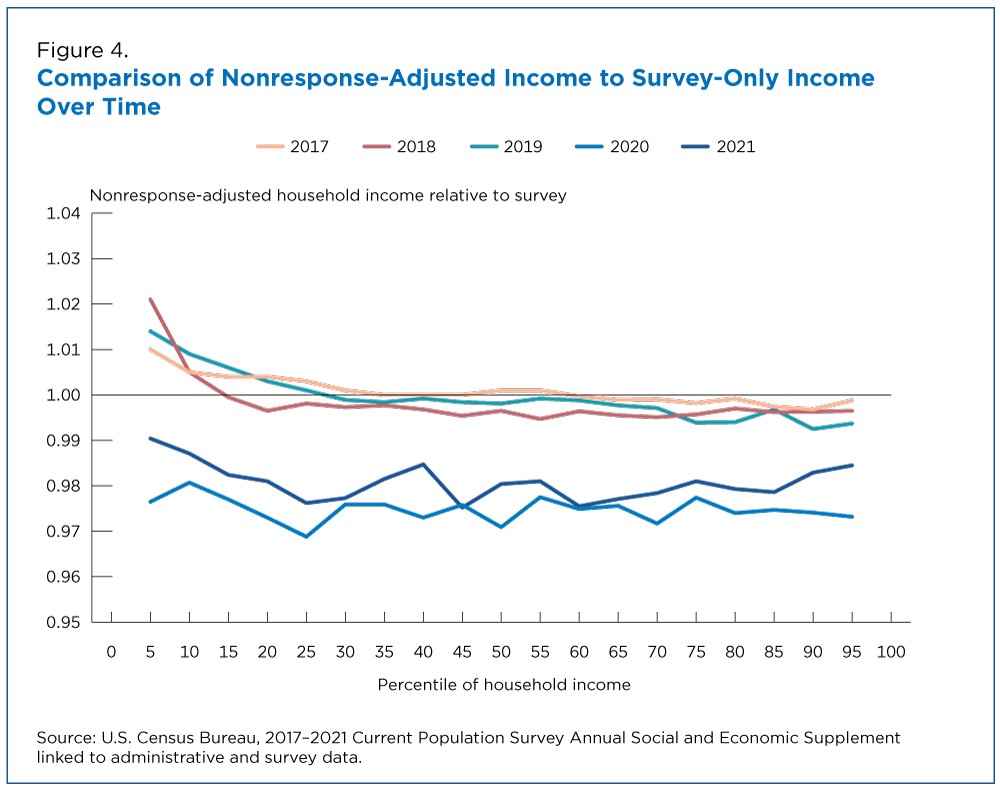
Source: U.S. Census Bureau, 2017-2021 Current Population Survey Annual Social and Economic Supplement linked to administrative and survey data.
In both 2020 and 2021, the poverty rates with the alternative weights were not statistically different from the survey estimates.
To sum up, nonresponse bias still exists this year despite the higher response rate.
More information on the alternative weighting methodology is available in a Census Bureau working paper at <www.census.gov/library/working-papers/2020/demo/SEHSD-WP2020-10.html>.
[1] This blog is available at <www.census.gov/newsroom/blogs/research-matters/2020/09/pandemic-affect-survey-response.html>. More information about the design of the survey, including weighting for nonresponse, is available in Technical Paper 77 at <https://www2.census.gov/programs-surveys/cps/methodology/CPS-Tech-Paper-77.pdf> and a summary of weighting in the CPS at <www.census.gov/programs-surveys/cps/technical-documentation/methodology/weighting.html>.
[2] When comparing respondent and nonrespondent earnings across the distribution, the estimates for 2020 and 2021 were statistically different only at the median.
[3] None of the differences between 2020 and 2021 in the figure are statistically significant.
[4] This figure comes from a regression of household response on income and various demographic and socioeconomic characteristics. $25,000 to $50,000 is the baseline earnings group. Therefore, the positive coefficient for “>=200,000” in 2020 indicates that households with $200,000 or more in earnings were more likely to respond to the CPS ASEC than households with $25,000 to $50,000 in earnings, after controlling for factors like race, Hispanic origin, age, etc.
[5] Note that we continue to refer to the survey years in the text, tables and figures to keep the year references consistent and more clearly identify the 2020 CPS ASEC and the 2021 CPS ASEC as the ones affected by the pandemic. Keep in mind that the reference period is the prior year in the CPS ASEC. Therefore, for example, when we discuss statistics from the 2020 CPS ASEC, we are discussing income earned or received in 2019. For the 2021 CPS ASEC, we are discussing income earned or received in 2020.
[6] We also compare the impact of the alternative weights on income relative to the survey estimates in 2021 vs. 2020. None of the differences are statistically significant.
Page Last Revised - October 8, 2021
✕
Is this page helpful?
 Yes
Yes
 No
No
 Yes
Yes
 No
No✕
NO THANKS
255 characters maximum
 255 characters maximum reached
✕
Thank you for your feedback.
Comments or suggestions?

Comments or suggestions?