
Official websites use .gov
A .gov website belongs to an official government organization in the United States.
Secure .gov websites use HTTPS
A lock (
) or https:// means you’ve safely connected to the .gov website. Share sensitive information only on official, secure websites.

Activities
Resources
Standards
About
Celebrate Black History, Love, and More With SIS February Classroom Re
From Black History Month to Valentine’s Day, February brings a lot of great reasons to celebrate, and the Census Bureau’s Statistics in Schools (SIS) program has plenty of resources to help bring excitement about real-world data to your classroom.
Test your students’ knowledge about the African American population in recognition of Black History month; share our Fun Facts about Valentine’s Day; and have students explore leaders past and present with our related warm-up activity on Presidents’ Day. These tools will help you incorporate Census Bureau data into your lessons while students are learning about these important observances.
Last but not least, check out our Activity of the Month, selected just for you by one of our SIS staff members!
Black History Month
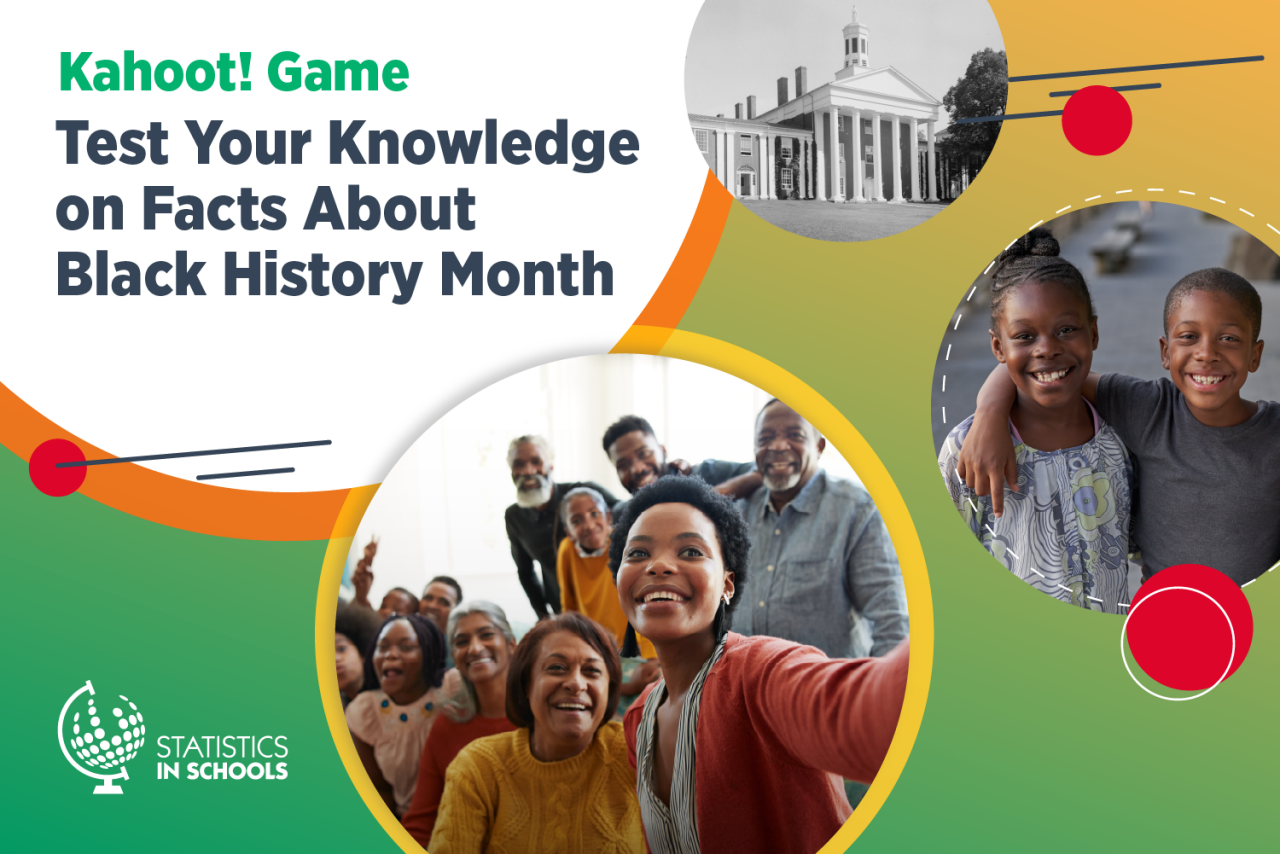
Do your students know which state had the fastest-growing Black population in 2021? Get their brains in gear with our Black History Month Kahoot! game. Hint: There are clues in our related Fun Facts handout.
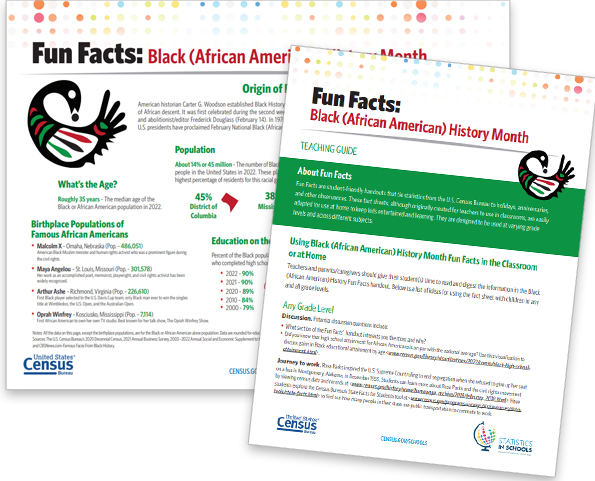
The handout includes information about the origin of Black History Month, birthplace populations of famous African Americans, and more. The accompanying teaching guide provides grade-level appropriate ways to further the discussion, from a writing exercise about students’ favorite music artist to creative thinking opportunities based on a bulletin written by W.E.B. Du Bois, a sociologist, historian, civil rights activist, and the first African American to earn a doctorate.
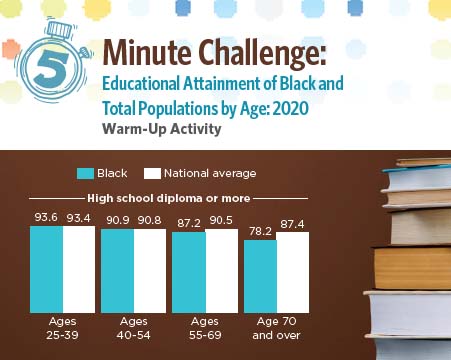
Take a quick dive into the educational attainment of the U.S. Black population with our 5-Minute Challenge Warm-Up Activity. This activity allows students to explore the percentages of different age groups and education levels of the Black population compared to national averages.
Valentine's Day
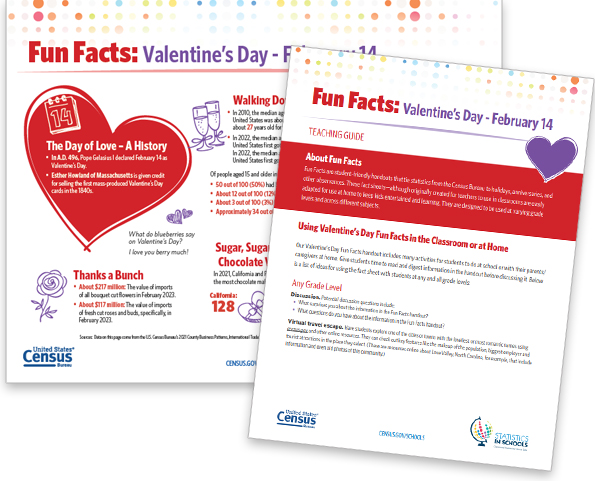
What do blueberries say on Valentine’s Day?
I love you berry much!
Love is in the air! Our Valentine’s Day Fun Facts shares interesting information like the history of this special day; the median age of women and men at their first marriage; cities and towns with the loveliest names – and more. Review the teaching guide to find ways to expand students’ thinking on topics. Examples include engaging students in a debate about marriage ages or creating a visual representation of a data point in the fact sheet.
Presidents' Day
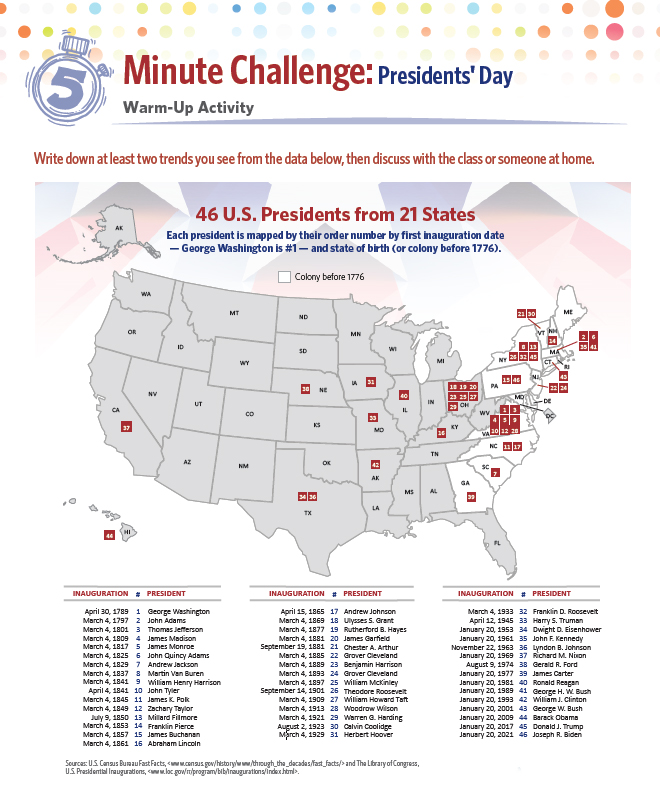
Presidents’ Day is February 20. Commemorate the occasion with our related 5-Minute Challenge Warm-Up Activity. For this activity, students review a map of the United States that lists U.S. presidents by the first inauguration date in their state (or colony before 1776) of birth. They then identify trends and discuss what they’ve learned with the rest of the class.
Activity of the Month
SIS has a variety of standards-based activities that students in all grade levels can use in the classroom. In this section of our newsletter, an SIS staff member has handpicked one of their favorites for you to explore.
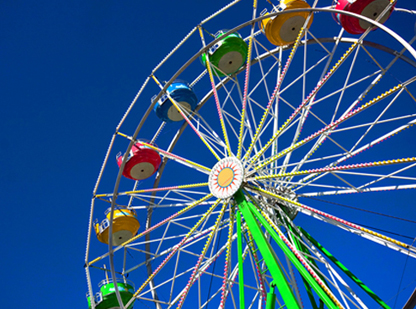
Are your students thrill seekers? Learn more about amusement parks across the nation with our fun elementary school math activity, Using Fractions to Compare Amusement Parks by State. This activity has students predict how many amusement parks are in their state, and then analyze data on the number of amusement parks in all 50 states in 2021 using our State Facts for Students tool. Then, they will write numbers as fractions and create a visual model of the data.
Page Last Revised - March 19, 2024
✕
Is this page helpful?
 Yes
Yes
 No
No
 Yes
Yes
 No
No✕
NO THANKS
255 characters maximum
 255 characters maximum reached
✕
Thank you for your feedback.
Comments or suggestions?

Comments or suggestions?