Facts for Features: Halloween Oct. 31, 2013
Halloween, which dates back to Celtic rituals thousands of years ago, has long been associated with images of witches, ghosts and vampires. Today, Halloween has evolved into a celebration characterized by child-friendly activities, such as costumes, trick-or-treating and carving pumpkins into jack-o'-lanterns.
Trick or Treat!
41.1 million
The estimated number of potential trick-or-treaters in 2012 — children age 5 to 14 -- across the U.S. Of course, many other children — older than 14 and younger than 5 — also go trick-or-treating.
Source: U.S. Census Bureau, 2012 Population Estimates <//www.census.gov/popest/data/index.html>
115 million
Number of occupied housing units across the nation in second quarter 2013 -- all potential stops for trick-or-treaters.
Source: U.S. Census Bureau, Housing Vacancies and Homeownership, Table 8 <//www.census.gov/housing/hvs/data/histtabs.html>
93.3%
Percentage of households with residents who considered their neighborhood safe in 2011. In addition, 79.5 percent said there was no place within a mile of their homes where they would be afraid to walk alone at night.
Source: U.S. Census Bureau, Extended Measures of Well-Being: Living Conditions in the United States, 2011 <//www.census.gov/library/publications/2013/demo/p70-136.html>
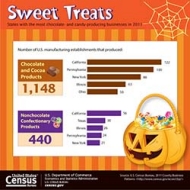
1,148
Number of U.S. manufacturing establishments that produced chocolate and cocoa products in 2011, employing 35,538 people. California led the nation in the number of chocolate and cocoa manufacturing establishments, with 122, followed by Pennsylvania, with 109.
Source: U.S. Census Bureau, 2011 County Business Patterns
< //www.census.gov/econ/cbp/>
440
Number of U.S. manufacturing establishments that produced nonchocolate confectionary products in 2011. California led the nation in this category, with 56.
Source: U.S. Census Bureau, 2011 County Business Patterns < //www.census.gov/econ/cbp/>
Where to Spend Halloween?
Some places around the country that may put you in the Halloween mood are:
Tombstone, Ariz. (estimated population 1,358)
Source: U.S. Census Bureau, 2012 Population Estimates
<//factfinder2.census.gov/bkmk/table/1.0/en/PEP/2012/PEPANNRES/1620000US0474400>
Sleepy Hollow, Ill. (estimated population 3,339)
Source: U.S. Census Bureau, 2012 Population Estimates
<//factfinder2.census.gov/bkmk/table/1.0/en/PEP/2012/PEPANNRES/1620000US1770161>
Kill Devil Hills, N.C. (estimated population 6,827)
Source: U.S. Census Bureau, 2012 Population Estimates
<//factfinder2.census.gov/bkmk/table/1.0/en/PEP/2012/PEPANNRES/1620000US3735720>
Yellville city, Ark. (estimated population 1,196)
Source: U.S. Census Bureau, 2012 Population Estimates
<//factfinder2.census.gov/bkmk/table/1.0/en/PEP/2012/PEPANNRES/1620000US0577330>
Transylvania County, N.C. (estimated population 32,849)
Source: U.S. Census Bureau, 2012 Population Estimates
<//factfinder2.census.gov/bkmk/table/1.0/en/PEP/2012/PEPANNRES/0500000US37175>
Slaughter Beach town, Del. (estimated population 215)
Source: U.S. Census Bureau, 2012 Population Estimates
<//factfinder2.census.gov/bkmk/table/1.0/en/PEP/2012/PEPANNRES/1620000US1067050>
Casper, Wyo. (estimated population 57,813)
Source: U.S. Census Bureau, 2012 Population Estimates
<//factfinder2.census.gov/bkmk/table/1.0/en/PEP/2012/PEPANNRES/1620000US5613150>
Scarville, Iowa (estimated population 71)
Source: U.S. Census Bureau, 2012 Population Estimates
<//factfinder2.census.gov/bkmk/table/1.0/en/PEP/2012/PEPANNRES/1620000US1971040>
Truth or Consequences city, New Mexico (estimated population 6,411)
Source: U.S. Census Bureau, 2012 Population Estimates
<//factfinder2.census.gov/bkmk/table/1.0/en/PEP/2012/PEPANNRES/1620000US3579840>
Spooktacular Fun
4,575
The number of motion picture theaters (except drive-ins) where one could possibly enjoy a horrorfest. California (537), Texas (296), New York (272) and Florida (206) had the most of such establishments. There were 244 drive-in motion picture theaters in 2011 - Ohio, with 24, had the most.
Source: U.S. Census Bureau, 2011 County Business Patterns <//www.census.gov/econ/cbp/>
47,800
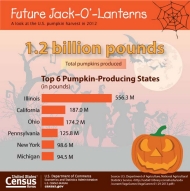
Acres of pumpkins harvested in the U.S. in 2012, with a total estimated production value of $148.9 million. Of the top six pumpkin-producing states, Illinois led the country by producing an estimated 556.3 million pounds of this vined gourd, followed by California, Ohio, Pennsylvania, New York and Michigan. Pumpkins are frequently carved as decorations around Halloween.
Source: U.S. Department of Agriculture, National Agricultural Statistics Service
<//usda01.library.cornell.edu/usda/nass/VegeSumm/2010s/2013/VegeSumm-01-29-2013.pdf> [PDF - 1.4 MB]
$165 million
The estimated seasonally adjusted annual rate of private nonresidential construction spending on theme/amusement parks for June 2013. Halloween events at theme/amusement parks can be frighteningly fun. For more information about Construction Spending, please visit:
<//www.census.gov/constructionspending>.
Source: U.S. Census Bureau, Manufacturing and Construction Statistics
<//www.census.gov/construction/c30/xls/privsatime.xls>
1,197
The number of costume rental and formal wear establishments; they had 6,936 paid employees (for pay period including March 12) across the nation in 2011.
Source: U.S. Census Bureau, 2011 County Business Patterns <//www.census.gov/econ/cbp/>
$1.1 billion
Dollar value of U.S. fresh apples exported in 2012. Mexico was the leading customer, purchasing $284 million worth. Whether bobbing for or dipping in caramel, apples can be a fun treat around Halloween.
Source: U.S. Census Bureau, Foreign Trade Statistics
<//www.census.gov/foreign-trade/index.html>
Who You Gonna Call?
89%
Percent of all households that had a cellular phone in 2011 compared with only 36 percent in 1998. The percentage of households with a cellular phone only (no landline) rose from less than 1 percent in 1998 to 28 percent in 2011.
Source: U.S. Census Bureau, Extended Measures of Well-Being: Living Conditions in the United States, 2011
<//www.census.gov/library/publications/2013/demo/p70-136.html>
The following is a list of observances typically covered by the Census Bureau’s Facts for Features series:
| Black (African American) History Month (February) Super Bowl Valentine's Day (Feb. 14) Women's History Month (March) Irish-American Heritage Month (March)/ St. Patrick's Day (March 17) Earth Day (April 22) Asian/Pacific American Heritage Month (May) Older Americans Month (May) Mother's Day Hurricane Season Begins (June 1) Father's Day |
The Fourth of July (July 4) Anniversary of Americans With Disabilities Act (July 26) Back to School (August) Labor Day Grandparents Day Hispanic Heritage Month (Sept. 15-Oct. 15) Unmarried and Single Americans Week Halloween (Oct. 31) American Indian/Alaska Native Heritage Month (November) Veterans Day (Nov. 11) Thanksgiving Day The Holiday Season (December) |
Editor’s note: The preceding data were collected from a variety of sources and may be subject to sampling variability and other sources of error. Facts for Features are customarily released about two months before an observance in order to accommodate magazine production timelines. Questions or comments should be directed to the Census Bureau’s Public Information Office: telephone: 301-763-3030; or e-mail: pio@census.gov.


